Bitcoin, Ether, Major Altcoins – Weekly Market Update June 7, 2021

The total crypto market cap added $65 billion to its value for the last seven days and now stands at $1,679 billion. The top 10 coins were all in green for the same time period with some of them posting double-digit gains. Binance Coin (BNB) and Dogecoin (DOGE) increased by 24 percent each. Bitcoin (BTC) is currently trading at $36,580, ether (ETH) is at $2,835.
BTC/USD
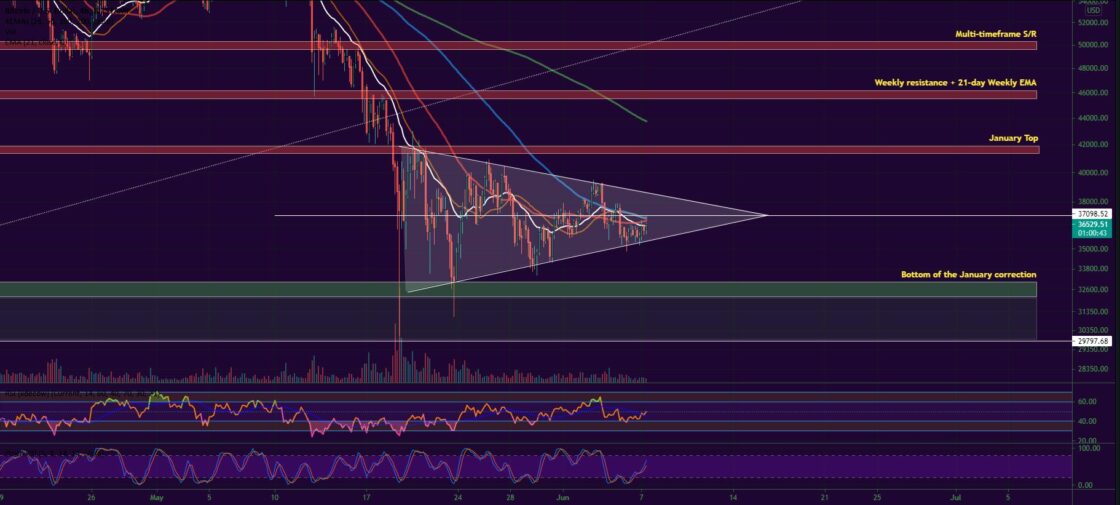
Bitcoin hit a weekly low of $33,347 on Sunday, May 30, and confirmed the $32,000-$33,000 zone as solid mid-term support. It registered a 3 percent increase on a seven-day basis and avoided further decline to the sub-$30k levels thus keeping the hopes for an upside reversal alive.
It is worth noting that the BTC/USDT pair was extremely volatile, moving up and down the $40,800 – $33,500 zone during the period, which suggested a lack of momentum in any of the price directions.
On Monday, buyers pushed the price above to the important $37,000 horizontal S/R and formed the second consecutive green candle on the daily chart by reaching $37,300. The move resulted in a 4.3 percent growth in value for the leading cryptocurrency.
Bitcoin closed its worst 30-day period since November 2018 dropping 35 percent thanks to a group of fundamental factors impacting the perspectives in front of the bitcoin mining process.
On Tuesday, June 1 BTC hit the upper boundary of the bearish pennant formation on the daily chart at $37,900 and corrected its price down to $36,600 thus losing the local support line once again.
The mid-week session on Wednesday came with a breakout attempt as bulls managed to push the price up to $38,200 and to surpass the mentioned triangle-like formation before retracing to $37,500 at the daily candle close.
On Thursday, June 3, the BTC/USDT continued to look stable making its way up to $39,100. However, the decreasing volumes and the persistent pressure from the Chinese government and Elon Musk were making it hard for buyers to intervene due to a lack of stability and upside potential in the price of BTC.
On Friday the coin started falling. It erased 6 percent for the day closing right below the local support at $37,000.
The weekend of June 5-6 began with another step-down – to $35,500 on Saturday as bitcoin was fighting hard to defend both the horizontal and diagonal supports.
On Sunday, it remained almost flat, with no drastic changes in the direction. Still, the price managed to keep floating above the lower boundary of the triangle.
BTC is 1.6 percent up midday on Monday.
4-hour chart:

ETH/USD
The price of the Ethereum Project token ETH continued to strictly follow the technical indicators and trend-defining formations on all timeframes.
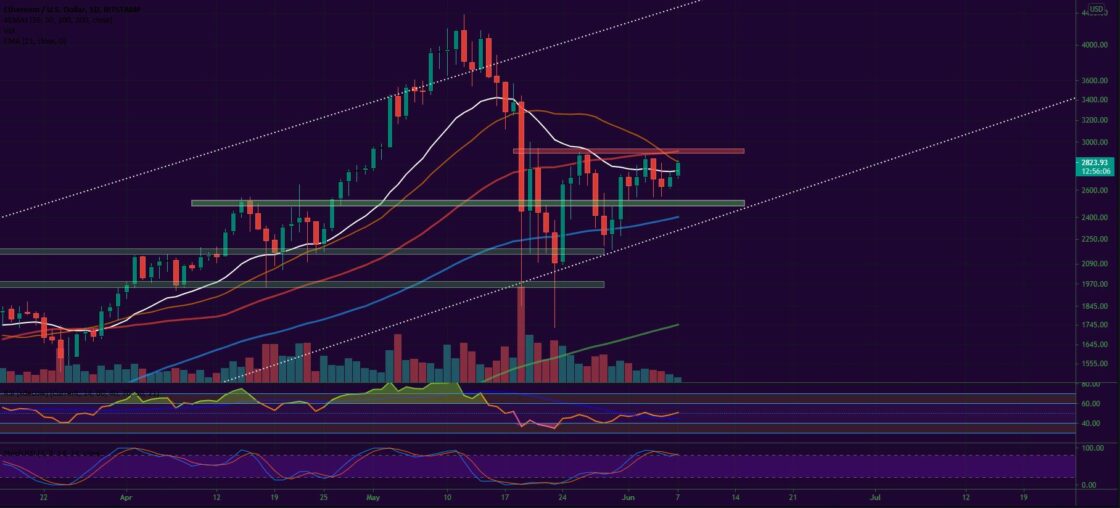
On Sunday, May 30 it hit a weekly low of $2,170, touching the lower end of the long-term uptrend corridor. Earlier in the week, the coin touched the meeting point of the horizontal resistance, the 21-day EMA, and the newly formed diagonal line at $2,900, which triggered a 20+ percent selloff.
The ether added 14.4 percent up on a weekly basis, rebounding perfectly from the 21-day EMA on the bigger timeframe.
On Monday, the ETH/USD pair resumed the uptrend rally and reached the $2,700 mark while breaking the $2,500 S/R line. It ended the month of May 2.5 percent lower compared to the previous 30-day period.
On the very next day, the coin made a short retrace, during which the mentioned line was successfully re-tested.
The third day of the workweek was a continuation of the upward movement. The leading altcoin was trading as high as $2,800 but closed the session at $2,700.
On Thursday, June 3 bulls registered a failed attempt to break above the $2,900 area. The price of ETH last closed above that line on May 19, which is making it a serious obstacle in front of the short to mid-term recovery.
The rejection resulted in a pullback on Friday when the coin erased all gains from the previous session and almost re-tested the $2,500 support yet again.
The first day of the weekend came with some strong selling volumes as the token formed a second straight red candle around the 21-day EMA.
Then on Sunday, bulls were very active in the first part of the session but were later stopped around the mentioned moving average, eventually closing at $2,700.
The ether is trading 6 percent higher as of the time of writing this market update on Thursday.

Top 10
- Solana (SOL)
Solana is one of the fastest-growing Ethereum competitors, right after Polkadot and Binance Smart Chain, but the project is gaining more and more traction within the industry thanks to its speed and censorship resistance.
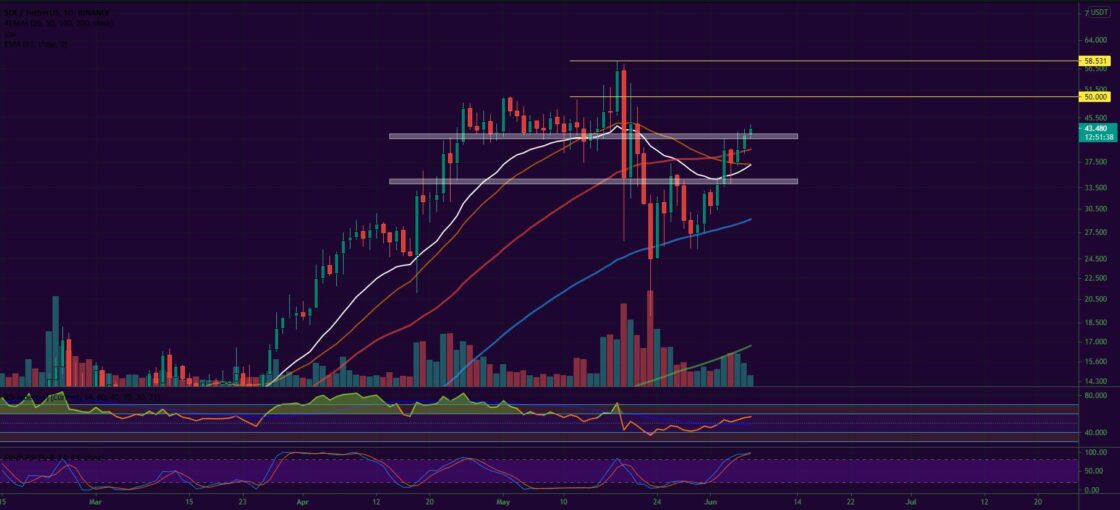
The SOL token is in an uptrend ever since it hit a $25 low at the end of May. Since then, it has added approximately 68 percent to its value and is now pushing to stabilize above the $40-$42 resistance on the daily chart.
The expected delay in Ethereum 2.0 inspired a comeback in the other major blockchain ecosystems. Solana is now ranked #15 on the Top 100 list with a stunning $11.8 billion market cap.
The next target for the SOL/USDT pair will be $50, followed by the all-time high at $58. Expected support in the $36-$34 zone.

Altcoin of the Week
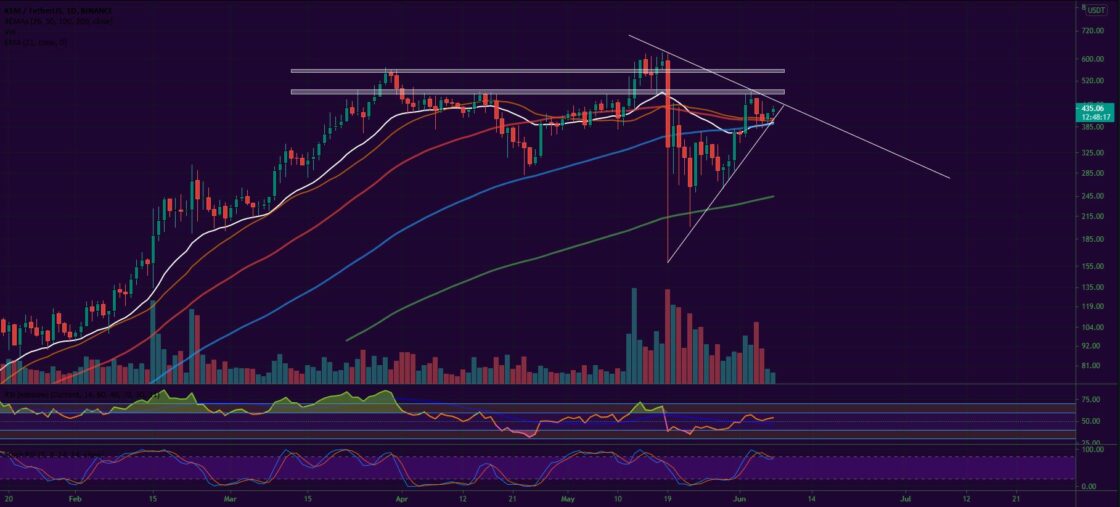
Our Altcoin of the week is Kusama (KSM). The test net platform of the Polkadot ecosystem added 35 percent to its value for the last seven days after jumping up from the 21 EMA on the Weekly timeframe. The coin was 57 percent up at some point during the week but hit a serious resistance in the $490 area.
The main reason behind the recent rally is without a doubt the upcoming parachains auctions on the Kusama network. The process in general represents a distribution of blockchain slots on the test relay network through public crowdfunding where KSM is used to guarantee allocation.
The KSM token moved up to #32 on CoinGecko’s Top 100 list with a total market cap of approximately $3.65 billion. It peaked at $493 on June 3 and as of the time of writing this is trading at $435.


