Bitcoin, Ether, Major Altcoins – Weekly Market Update March 14, 2022

The total crypto market cap erased $2 billion from its value for the last seven days and now stands at $1.73 billion. The top 10 coins showed mixed results for the same time period with Terra (LUNA) adding 16.5 percent while Solana (SOL) was the worst performer with 4.8 percent of losses. Bitcoin (BTC) is currently trading at $38,760 while ether (ETH) is at 2,570.
BTC/USD
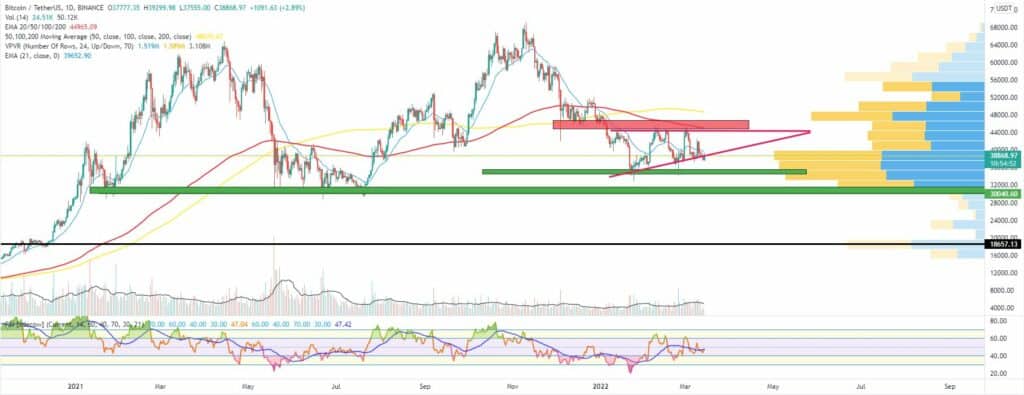
Bitcoin closed the trading day on Sunday, March 6 at $38,405 after a week full of uncertainties that drove the price of the biggest cryptocurrency to the zone below $40,000. It managed to add almost 2 percent on a weekly basis, but the most important part is it was heavily rejected at the 21-period EMA on the weekly chart, forcing it to retrace by more than 15 percent.
The new week started with another red session during which the BTC/USDT pair briefly touched $37,250 before recovering to the area above the improvised short-term diagonal uptrend line.
On Tuesday, March 8, bitcoin formed a small green candle to $38,700 on the daily chart as the news about the upcoming crypto regulations from the United States government agencies seemed not to have that much of an impact on the price.
The mid-week session on Wednesday came with a solid push in the upward direction. The leading cryptocurrency climbed all the way up to $42,000 adding 8 percent.
Bitcoin was slowly building an ascending triangle pattern on the daily chart, which is usually a bullish formation, but when taking part in an ongoing uptrend.
$42,000 was the next major obstacle in front of bulls.
On Thursday, March 10, the coin rapidly changed its direction. It almost fully erased all gains from the previous session decreasing by 5.8 percent to closed the day at $39,500, below the 21-day EMA.
The selloff continued through Friday when BTC formed its second consecutive day in red, hitting $38,750.
The weekend of March 12-13 started with a flat session on Saturday as bulls were successful in defending the lower boundary of the ascending triangle formation. The improvised short-term uptrend line served as a last point of defense above $35,000.
Then on Sunday, it broke below that line to end the week at $37,648 or 2.2 percent lower.
What we are seeing midday on Monday is a small bounce as BTC is trading at $38,780.

ETH/USD
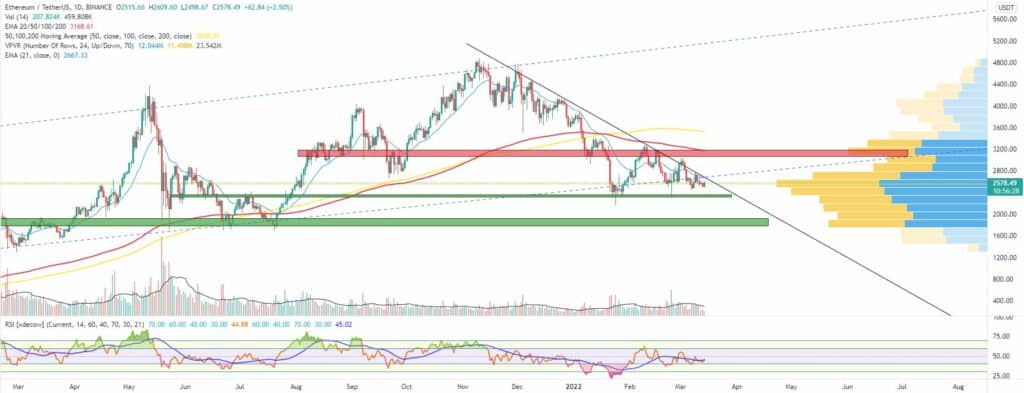
The Ethereum project token ETH closed the trading day on Sunday, March 6 at $2,558 losing 2.2 percent of its valuation on a seven-day basis and closing its weekly candle below the lower boundary of the long-term uptrend corridor for the first time since January 2021. The coin could not keep up the uptrend momentum and retraced by more than 13 percent after hitting the next big resistance cluster above $3,000.
On Monday, the ETH/USDT pair formed a second consecutive red candle on the daily chart by dropping down to $2,498. The coin was trading in the $2,650 – $2,450 range throughout the day.
The second session of the workweek brought some relief for bulls. The ether climbed up to $2,575 in a bullish engulfing supported by relatively high daily volumes.
On Wednesday, March 9, the price of ETH reached the 21-day EMA but was not able to break past the diagonal downtrend line
The next key objective in front of the Ethereum token bulls was to surpass the extremely fortified zone between $2,700 and $2,800. There we could see the 21-day EMA, the mid-term diagonal downtrend, and the most actively traded zone as per the Volume Profile Indicator (VPVR). The ether was still caught below the mentioned uptrend channel.
On Thursday, the ETH/USDT pair reversed its direction after suffering rejection in the above-mentioned area. It lost 4.2 percent to closed the day at $2,612 hit by the bad US inflation data.
The Friday session was no different and bears continued to be in full control pushing the price further down to $2,558.
The first day of the weekend came with a relatively calm session during which the ETH token remained flat, hovering around $2,550.
Then on Sunday, it dropped down to $2,510 thus losing the short-term weekly horizontal support.
As of the time of writing, the ether is trading at $2,570.

Leading Majors
- Polkadot (DOT)
Polkadot is a meta protocol – a Layer 0 that enables multiple blockchains to connect to each other, be interoperable, decentralized, and scalable while benefiting from the security of the Relay chain.
The coin fell out of the Top 10 recently but made a strong comeback during the last seven days while the majority of the altcoins were bleeding in red.
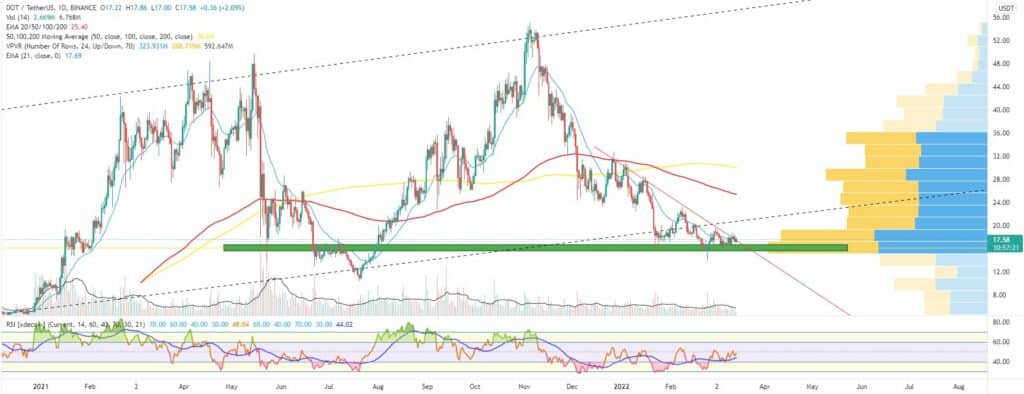
The DOT/USDT pair increased by 7 percent and the zone around $16 proved to be extremely stable from a mid to long-term perspective.
Next for buyers will be to surpass the diagonal downtrend line and 21-day EMA then break back into the weekly uptrend channel.
From a daily timeframe perspective, the $18-$19 area is the most actively traded one on the chart, so a break above it will be crucial.

Altcoin of the Week
Our Altcoin of the week is Zcash (ZEC). The privacy coins are once again on the move as a result of the Russian invasion in Ukraine and the sanctions imposed by the collective West on the Russian oligarchs and financial institutions which made them look for different ways to circumvent these restrictions and move their money. Coins like ZEC and Monero were among the biggest gainers in the last seven days.
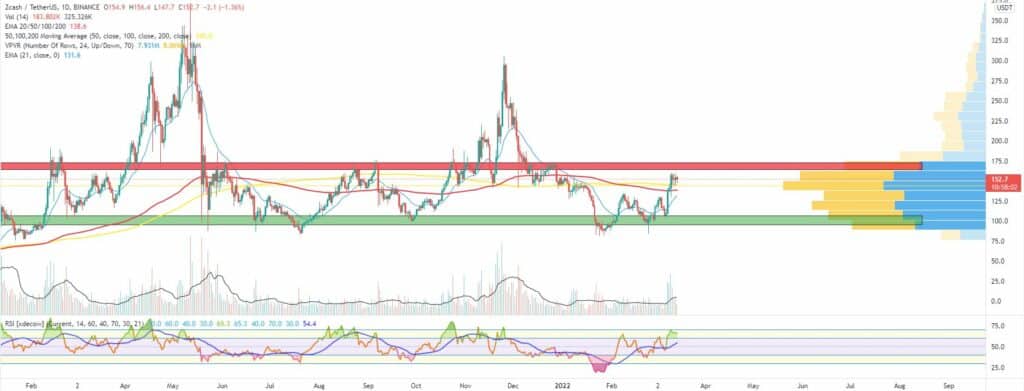
Zcash in particular added 44 percent to its valuation on a weekly basis after bouncing up from the $90-$100 support area a few weeks back. The ZEC token uses zk-SNARK zero-knowledge cryptography which allows its users to safely transfer funds guaranteeing their privacy and making the transactions untraceable.
The coin is currently ranked at #61 on CoinGecko’s Top 100 list with a market cap of approximately $1.9 billion. The next major resistance in front of the ZEC/USDT pair is the $165-$170 zone.


