Bitcoin, Ether, Major Altcoins – Weekly Market Update March 21, 2022

The total crypto market cap added $140 billion to its value for the last seven days and now stands at $1.87 billion. The top 10 coins were all in green for the same time period with Avalanche (AVAX) and ether (ETH) adding 32.8 and 15.7 percent to their values respectively. Bitcoin (BTC) is currently trading at $41,260 while ETH is at 2,920.
BTC/USD
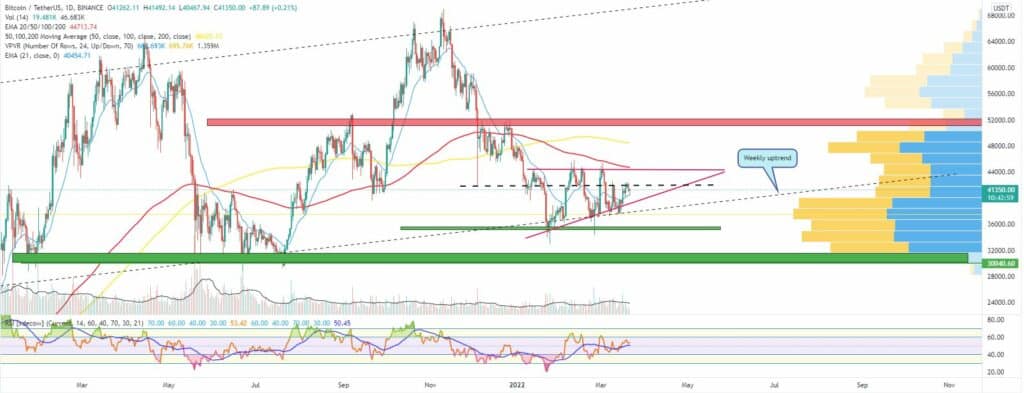
Bitcoin closed the trading day on Sunday, March 13 at $37,750 after a four-day long price correction. The coin found itself once again below the 21-day EMA on the daily timeframe chart and also broke below the lower boundary of the improvised ascending triangle pattern. As we mentioned last week, the Ascending triangle is a bullish pattern but only when it is preceded by a strong uptrend.
BTC ended the week 1.7 percent lower, but manage to keep trading in the long-term uptrend corridor.
Bulls showed up on Monday, pushing the price up to $39,730 or 5.5 percent higher on the news that a deal to end the Russia-Ukraine conflict might be close.
On Tuesday, the BTC/USDT pair fell down to $39,200 but not before touching $38,100 during the intraday session. The market could not find its direction following the United States Crypto Executive Order signing as traders were split in their opinion whether the news is bullish or bearish.
The third day of the workweek came with a solid green candle as BTC surpassed the short-term EMA and was closing in on the $42,000 mark which already proved to be solid resistance. The coin added 4.5 percent for the day.
On Thursday, March 16 the coin closed in red, but still remained above the 21-day EMA in a potential uptrend continuation towards the mentioned weekly horizontal resistance.
The Friday session came with a re-test of the $42,000 level as bitcoin added another 2.2 percent and continued to perform quite well despite the series of bearish news announced in the last few weeks.
The weekend of March 19-20 started with a small green candle to $42,160 on Saturday as the coin was attempting to surpass the September 2021 bottom.
On Sunday it suddenly started moving South ending the week at $41,250 with a 2.5 percent loss as the weekly resistance line around $42,000 remained unbreakable.
BTC is currently trading at $41,300.
ETH/USD
The Ethereum project token ETH ended the previous seven-day period with a 1.2 percent loss. It was the fifth consecutive weekly candle in red for the biggest altcoin and 11th for the last 16 weeks.
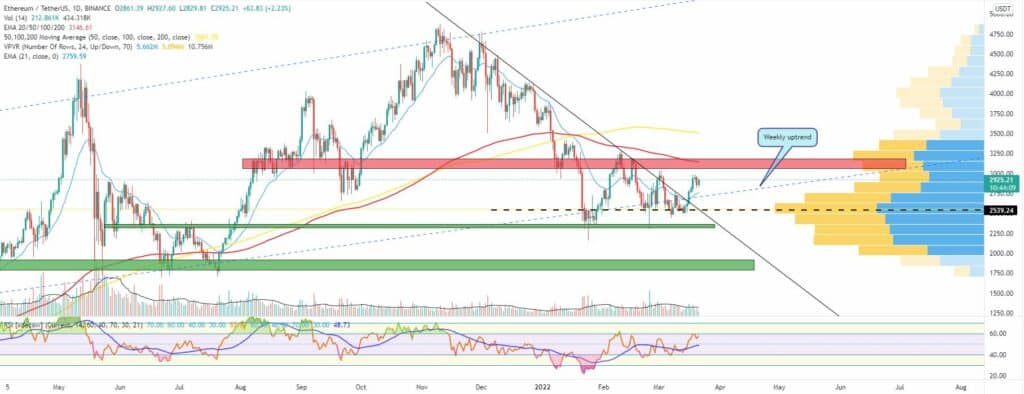
The long-term uptrend corridor was broken and so was the $2,500 horizontal support.
On Monday, March 14, the ETH/USDT pair started moving strongly in the upward direction. It jumped up to $2,587 adding 3.5 percent to its valuation.
The move was followed by a high volatility session on Tuesday during which the coin was trading in the $2,665 – $2,500 area before closing at $2,619.
The mid-week session on Wednesday came with a significant increase in the price of ETH. It grew by 5.8 percent and closed the day at $2,769.
It is worth noting that the coin was now back above both the $2,500 horizontal and the lower boundary of the diagonal uptrend corridor. It also surpassed the 21-day EMA in the upward direction and broke the mid-term diagonal downtrend line. The most actively traded zone as per the VPVR (Volume profile indicator) was also left behind.
On Thursday, March 17, the ether continued to move in the upward direction, this time stopping at $2,820, confirming the above-mentioned break of the major resistances.
The Ethereum protocol merged on the Kiln test net in preparation for its long-expected transition to Proof of stake (PoS) later this year. Kiln is the last development environment before the public testnets are upgraded.
Ethereum holders and buyers were betting hard on this event and started bidding even more with the ETH token climbing to $2,930 on the last day of the workweek, increasing by another 4.5 percent.
The first day of the weekend started with a low volatility session during which the coin remained flat.
Then on Sunday it fell down to $2,854 re-testing the newly established diagonal.
The ETH/USDT pair is currently trading at $2,920 early on Monday.
Leading Majors
- Avalanche (AVAX)
The Avalanche ecosystem added 5 percent to its total value locked for the last seven days and still holds number 4 spot as per data from Defi Llama.
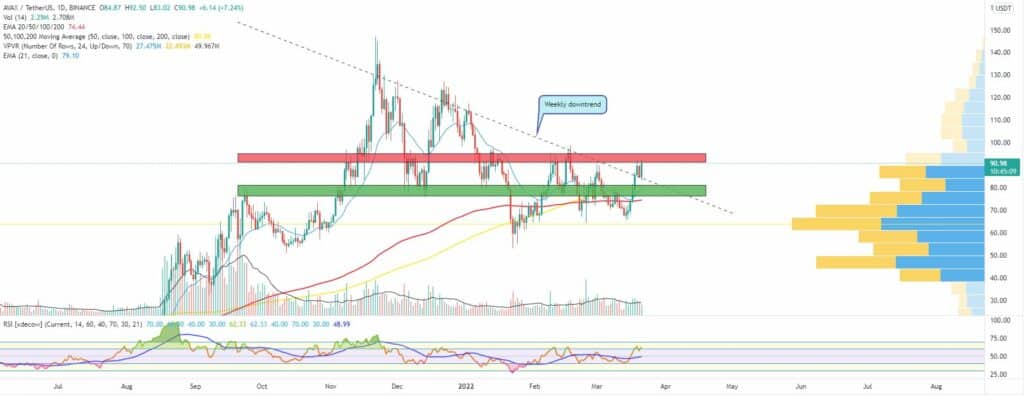
Its native token AVAX moved above the 21-period EMA on the weekly chart and hit the mid-term diagonal downtrend around $86. Earlier in the week it also re-tested the horizontal resistance above $90. The AVAX/USDT pair is still unable to surpass that line since early February when it first attempted a reversal to the upside.
Potential support at the $80-$83 area as marked on our daily timeframe chart.
The Avalanche token added 24 percent on a weekly basis and re-entered the Top 10 list on CoinGecko.
It is currently trading at $91.
Altcoin of the Week
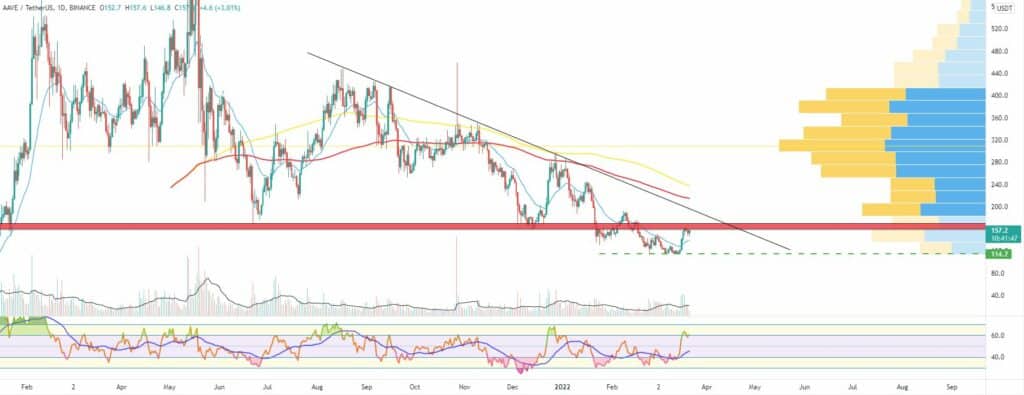
Our Altcoin of the week is Aave (AAVE). One of the original DeFi blue chips, AAVE is a decentralized lending and borrowing platform running on multiple blockchain ecosystems. It was one of the best performing cryptocurrency assets in the first half of 2021, but it is currently trading around 75 percent below its all-time high.
Still, the AAVE/USDT pair managed to find its bottom recently and added 31 percent to its valuation for the last seven-days reaching the area around $160, above its 21-day EMA on the daily timeframe.
The next resistance in front of bulls is the long-term weekly bottom between $160 and $170 followed by the diagonal downtrend line.
The main reason behind the recent rally in the price of the AAVE token is the launched Aave V3 protocol “with groundbreaking new features that span from increased capital efficiency to enhanced decentralization.”
The coin is currently ranked at #58 on the CoinGecko list with a total market capitalization of approximately $2.1 billion.
It is trading at $156 as of the time of writing.