Bitcoin, Ether, Major Altcoins – Weekly Market Update March 28, 2022

The total crypto market cap added $249 billion to its value over the last seven days and now stands at $2.12 billion. The top 10 coins were all in green for the same time period with Cardano (ADA) and Solana (SOL) leading the group with 35 and 24 percent gains respectively. Bitcoin (BTC) is currently trading at $47,160 while ether (ETH) is at 3,337.
BTC/USD
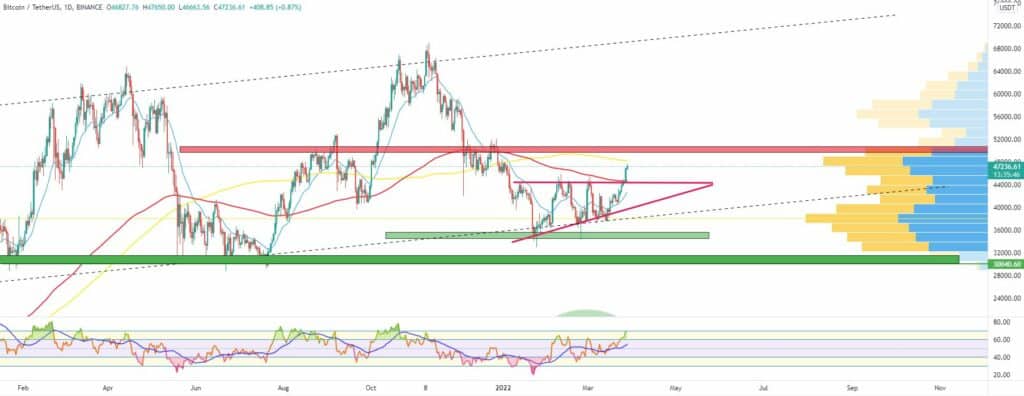
Bitcoin closed the trading on Sunday, March 20 at $41,166 after hitting the weekly resistance level at $42,000 on Saturday evening. The coin ended its six-day long uptrend but still registered a 9.5 percent increase on a weekly basis.
Not only that but BTC managed to rebound perfectly from the lower boundary of the long-term weekly uptrend corridor.
On Monday, bears pushed the price further down to hit the 21-day EMA near $40,670 before closing the day at $41,030 with a small loss.
The uptrend was resumed on Tuesday, March 22 when BTC climbed up to $42,300, moving above the mentioned horizontal resistance and adding 3.5 percent to its valuation. It is worth noting that the leading cryptocurrency was still trading in an ascending triangle figure on the daily chart making the zone above $44,000 the next major obstacle.
The mid-week session on Wednesday came with a second consecutive day in green. Bitcoin extended its gains by visiting $42,910. Trading volumes remain below average for the last 14 days while the RSI index is still below the overbought zone.
On Thursday, March 24, the BTC/USDT pair moved further up to $44,000 as it was closing in on the upper boundary of the ascending triangle.
It hit the zone above it on Friday, testing the horizontal resistance for the fifth time in the last 2.5 months. Still, buyers were not strong enough to support the breakout.
The first day of the weekend saw BTC closing flat at $44,579. Then on Sunday, it surpassed the mentioned resistance by forming a huge green candle up to $46,955 to close the week in green. The move resulted in a 6 percent price increase.
What we are seeing on Monday is a continuation of the uptrend as BTC broke into the December 2021 lows above $47,000.

ETH/USD
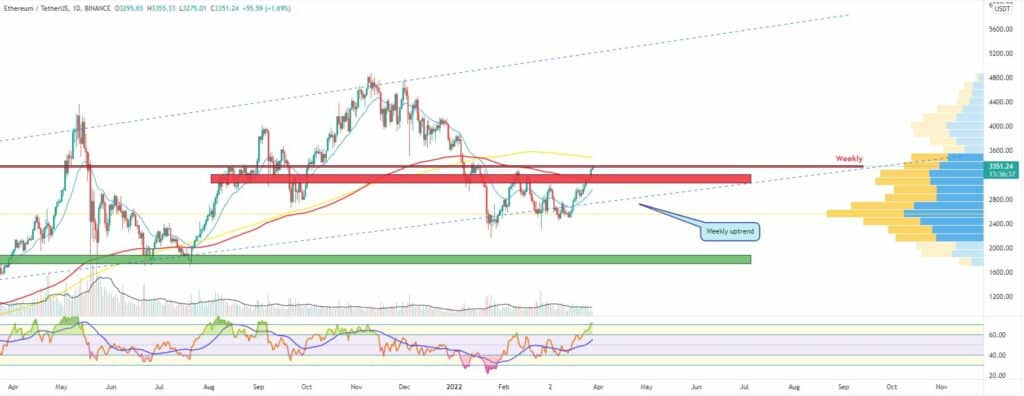
The Ethereum project token ETH successfully surpassed all major short to mid-term resistances in the last few weeks. It broke above both the 21-day EMA and the diagonal downtrend line and also was able to re-enter the long-term trading corridor.
It added 13.6 percent to its valuation for the previous last seven-day period establishing the $2,500 mark as a solid macro-support. On Sunday, March 20 we saw a pullback to the zone around $2,862 which resulted in a 2.6 percent loss. This was the first red candle on the daily chart for the last seven sessions.
On Monday, the ETH/USDT pair resumed the uptrend. It ended the session at $2,897 but not before hitting $2,966 during intraday.
Bulls continued to push on Tuesday as the ether reached the solid horizontal resistance in the $3,000-$3,200 area. The move resulted in another 2.5 percent being added to its valuation.
The third day of the workweek was no different and ETH reached $3,035 as 24-hour trading volumes were stable at the average for the last 14 days. The RSI indicator entered the overbought area.
On Thursday, March 24, buyers pushed the price further up to $3,108 close to the 200-day EMA on daily. The next resistance in front of buyers was the 21-EMA on the weekly chart (at $3,120) and the mentioned $3,000-$3,200 horizontal resistance.
On the last day of the workweek, the Ethereum token hit 3,194 in the morning then quickly retraced and closed the session in red.
Still, the rally continued during the weekend of March 26-27. First, on Saturday, the ether once again reached the zone around the mentioned long-term EMA. Then on Sunday, it broke above the above-mentioned horizontal resistance by touching $3,302, which resulted in a 4.8 percent price increase.
The biggest altcoin is trading even higher – at $3,341 midday on Mondy. If it manages to stay above $3,400 then there is no resistance all the way up to $4,000.

Leading Majors
- Solana (SOL)
The extremely popular layer 1 solution Solana is once again on the rise. The protocol was dubbed an Ethereum killer but to this day is not able to live up to the expectations mainly due to speculations about its highly centralized structure and governance.
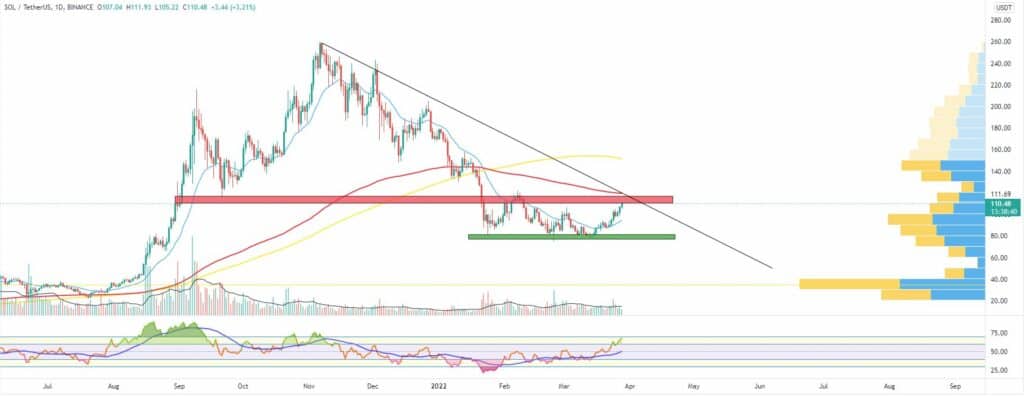
Yet, the SOL/USDT pair started moving in the upward direction two weeks ago when it hit a 7-month low at $75. Since then, Solana managed to add 39 percent to its market cap and successfully broke above the 21-day EMA.
It is now close to the multi-timeframe resistance in the $110-$115 area, right below the short-term EMA on the weekly chart.
We can expect support at the psychological line of $100.
Trading volumes are still way below the all-time highs and even the average values for the last month, but the RSI is entering the overbought area suggesting a high interest in the token.

Altcoin of the Week
Our Altcoin of the week is Zilliqa (ZIL)
Branded as the “world’s first sharding-based blockchain” Zilliqa is one of the best-known altcoins on the Top 100 list. It is using a second-layer scaling solution to offer high throughput and speed.
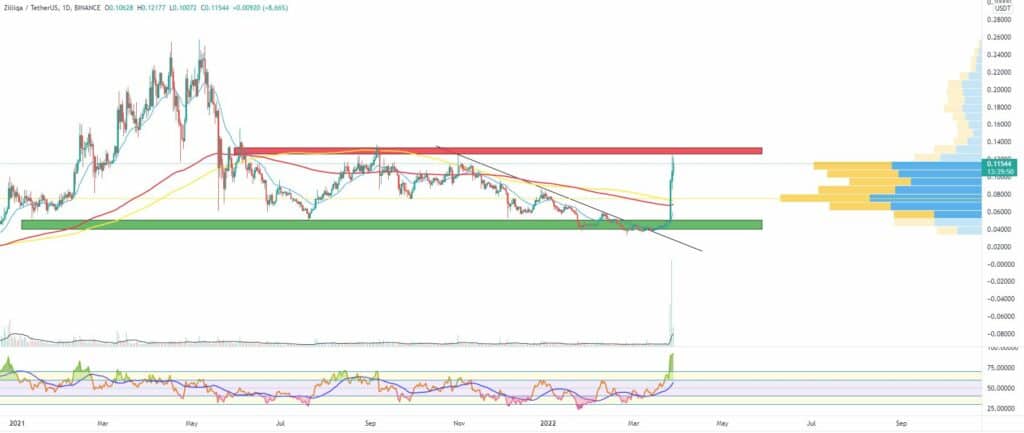
The coin added a stunning 152 percent to its value over the last seven days and moved up to #80 with a total market capitalization of approximately $1.45 billion. It successfully surpassed the 21-period EMA on the weekly timeframe and broke above the mid-term diagonal downtrend line.
The ZILUSDT pair peaked at $0.125 on March 27 and is currently trading at $0.115. Bulls will be looking to consolidate before attempting to break the $0.13-$0.14 horizontal resistance.
The most obvious reason for the recent surge in the price of Zilliqa is the recently announced Metapolis metaverse project which will be built on Unreal Engine, Unity, and Nvidia Omniverse. It will be the first “Metaverse as a Service (MaaS) and will be developed in partnership with Agora.


