Bitcoin, Ether, Major Altcoins – Weekly Market Update March 7, 2022

The total crypto market cap added $4 billion to its value for the last seven days and now stands at $1.73 billion. The top 10 coins showed mixed results for the same time period with Terra (LUNA) adding 13.3 percent while Cardano (ADA) was the worst performer with 3.7 percent of losses respectively. Bitcoin (BTC) is currently trading at $38,620 while ether (ETH) is at 2,560.
BTC/USD
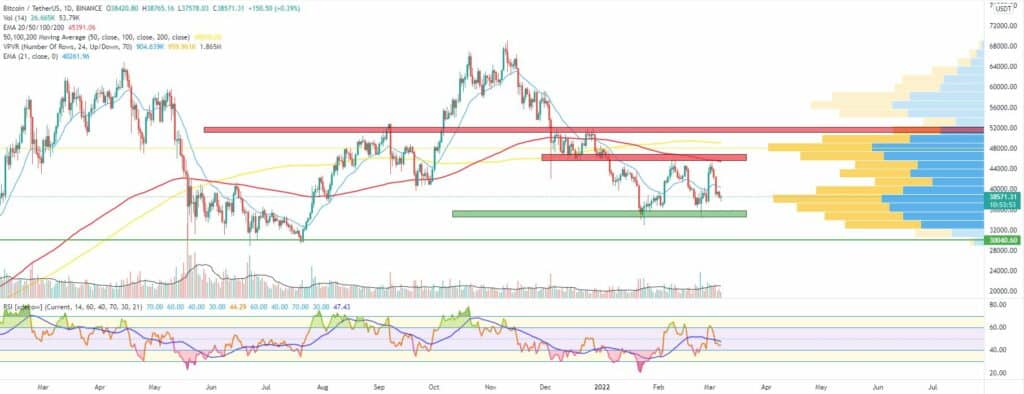
Bitcoin closed the trading day on Sunday, February 27 and the previous seven-day period at $37,747 after suffering rejection at the 21-day EMA on the daily timeframe and the lower boundary of the horizontal resistance situated in the $40,000-$42,000 zone. It registered a 2 percent loss after trading in the wide range between $34,200 – $42,200 throughout the week.
On Monday, the BTC/USDT pair made an unexpected reversal by forming a huge green candle on the daily chart. The coin added 14.7 percent surpassing the above-mentioned resistances to reach $43,180. It was one of the biggest one-day jumps in the history of bitcoin and it helped it close the monthly candle for February 12 percent up compared to January.
The Tuesday session came with a confirmation of the uptrend as buyers were looking to consolidate at the important short-term resistance near $44,500.
The mid-week session saw an early break of this price level. Bulls pushed the price up to $45,400 in the early hours of trading, but the momentum was not on their side and BTC eventually closed the day in red.
Bitcoin continued to move into negative territory on Thursday, March 3, and erased another 3.6 percent to stop at $42,500. Even with volumes that were higher than the average values for the last 14 days, the BTC bulls could not break above the $45,500 resistance making it a solid mid-term obstacle.
On Friday, the price moved below the 21-day EMA and closed below the $40,000 mark, at $39,100. This attributed to a 7.5 percent loss.
The weekend of March 5-6 started with a relatively calm session on Saturday, during which neither bulls nor bears were able to take over control of the price action. The coin remained flat in the $39,200 zone.
Then on Sunday, it continued to move South, ending the week at $38,350.
What we are seeing midday on Monday is a small green candle after BTC reached a daily low of $37,635 in the morning.

ETH/USD
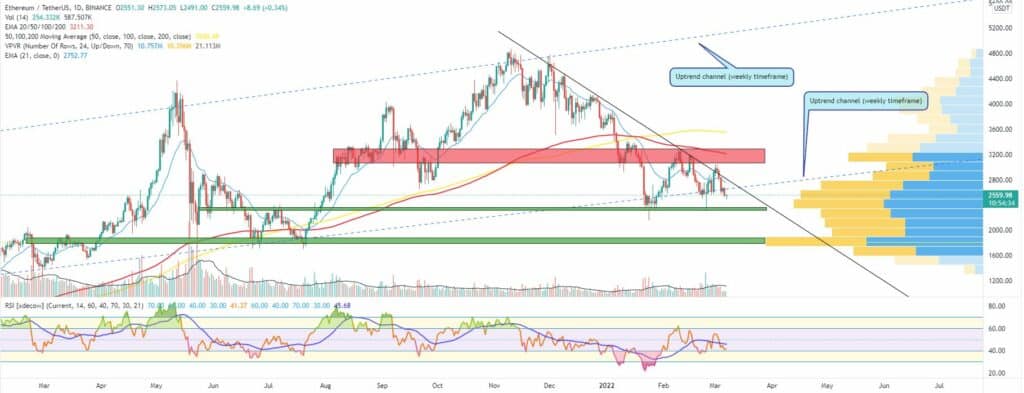
The Ethereum project ETH was rejected at the horizontal resistance and the 21-day EMA around $2,800 on Sunday, February 27. The coin lost 5.5 percent for the day and once again hit the long-term diagonal support. From a weekly perspective, it remained flat as bulls managed to avoid a drop below the mentioned dynamic support.
On Monday, the ETH/USDT pair increased by 12 percent and hit $2,920. The move helped the coin close the monthly candle 9 percent higher.
The next targets in front of the biggest altcoin were to consolidate above the resistance cluster and also break above the mid-term downtrend diagonal on the daily timeframe. On Tuesday, March 1, it continued to move in the upward direction by closing the session at $2,975 after temporarily climbing above the $3k mark.
The third day of the workweek came with a short pullback to the zone around $2,900. The wide $3,000-$3,300 zone is considered by many as the next big horizontal obstacle as it proved in the past to be a major point of interest for both bulls and bears.
On Thursday, March 3, the ether confirmed the rejection at the diagonal downtrend by falling further down to $2,826 and hitting the 21-day EMA. The move resulted in a 4.5 percent loss for the day.
The Friday session came with a further decrease to $2,621 as an additional 7 percent were erased. The coin was once again flirting with the long-term diagonal support.
The first day of the weekend came with a small green candle to $2,668 as bulls were nothing but convinced to defend the macro-trend.
Then on Sunday, the ether continued to decrease in price. It finally closed a weekly candle below the uptrend support line.
The ETH token is currently trading at $2,560.

Leading Majors
- Near (NEAR)
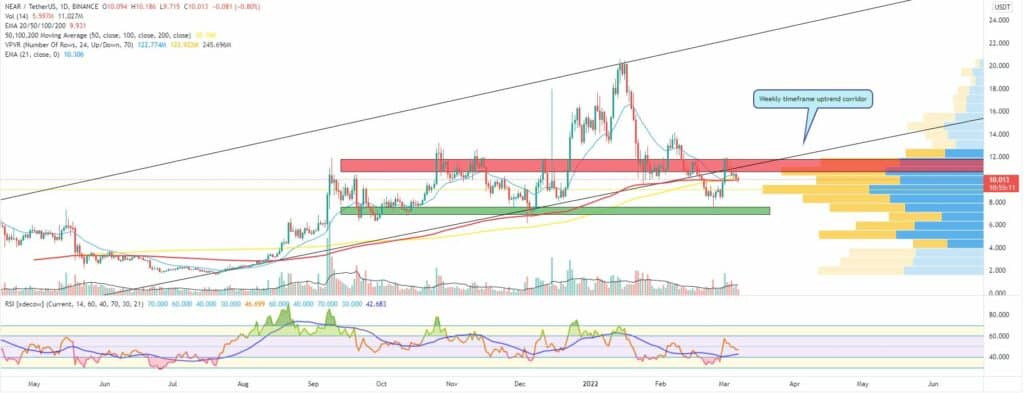
This popular Layer-1 blockchain is not in the Top 10 but is closely following the steps of LUNA and AVAX. It reached an all-time high back in early January by hitting $20.7, but since then retraced by more than 60 percent eventually finding support at the weekly horizontal around $7.
The NEAR/USDT pair added 17.9 percent during last week’s trading and is slowly building momentum for another rally. It is now hovering around the 21-period EMA on the weekly timeframe chart.
If bulls manage to break above this dynamic resistance and successfully close above the November weekly high of $11.8 then this will open the door for an attack of the all-time high since no major obstacles are visible on the larger timeframes.
NEAR is ranked at #22 with a total market cap of approximately $6.5 billion. It is currently trading at $10.07 as of the time of writing.

Altcoin of the Week
Our Altcoin of the week is Chiliz (CHZ). One of the leading cryptocurrency projects for sports and entertainment, Chiliz provides its blockchain infrastructure supports to the Socios.com fan engagement platform – the most well-known football fan token platform.
The team recently announced the launch of their Chiliz Chain 2.0 as the next evolution step. The platform is to be built by Ankr as the public test net launch for Chiliz Chain 2.0 is currently scheduled for Q1 of this year.
The above-mentioned event is most probably the driving factor behind the rise in the price of the CHZ/USDT pair in the last few days.
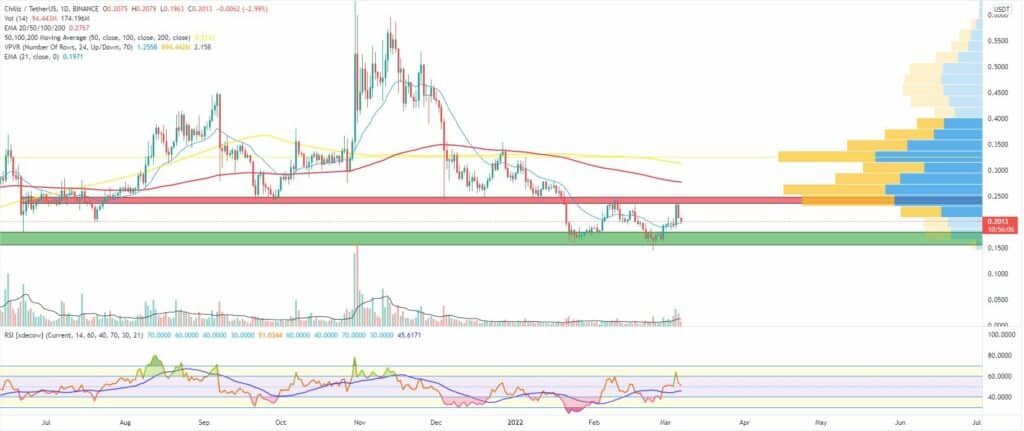
It moved up to hit a weekly high of $0.237 on Saturday, March 5 making it a 25 percent increase for the seven-day period.
The $0.15-$0.17 area looks like stable multi-timeframe support while the $0.24-$0.27 remains a strong resistance in combination with the 21-period EMA.
The CHZ token is currently trading at $0.20.


