Bitcoin, Ether, Major Altcoins – Weekly Market Update May 2, 2022

The total crypto market cap erased $41 billion from its value in the last seven days and now stands at $1.73 billion. The top 10 coins were all in red for the same time period with Cardano (ADA) and XRP (XRP) losing 11.8 and 11.6 percent respectively. Bitcoin (BTC) is currently trading at $38,800 while ether (ETH) is at 2,814.
BTC/USD
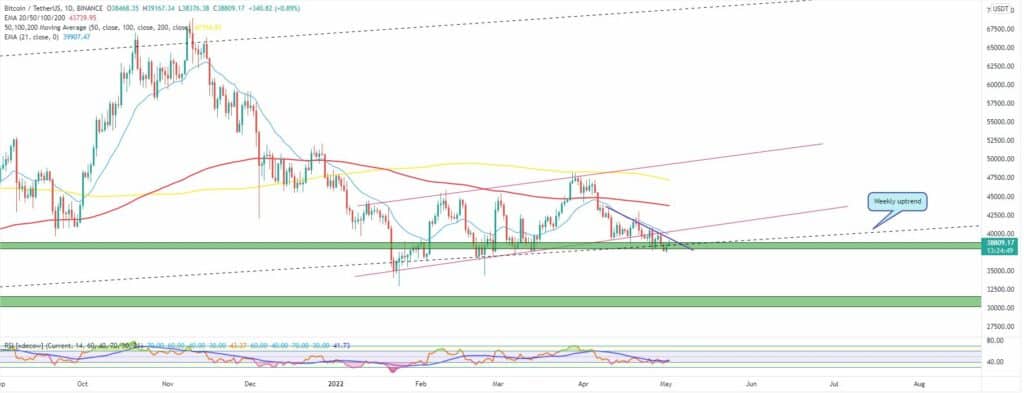
Bitcoin closed the trading day on Sunday, April 24 flat, at $39,500. As previously mentioned, the coin was trading in two bear flag patterns simultaneously on the daily chart, and during the weekend of April 23-24, it broke below the lower boundaries of both suggesting more downside could be in sight.
The BTC/USDT pair ended the previous seven-day period with a less than a percent loss.
On Monday, bears pushed the price all the way down to $38,220 in the early hours of trading to hit the horizontal support, but bulls were quick to react and BTC fully retraced and even erased the losses, eventually closing in green at $40,446.
The Tuesday session was slightly different as the biggest cryptocurrency bounced up to the 21-day EMA of around $40,800 in the morning, but then it crashed, drawing one of the biggest red candles in the last few weeks. It closed the day at $38,133 or 5.8 percent lower and broke all horizontal and diagonal supports in that area.
The mid-week trading day on Wednesday, April 27 came with a relief bounce as Bitcoin broke back into the long-term uptrend corridor and above the horizontal support. It added 3 percent to its market cap.
On Thursday, April 28 the coin continued to move in the upward direction. It reached the $40,370 mark intraday, but was rejected there at the newly formed short-term diagonal downtrend (also where the lower boundary of the bear flags was located).
The Friday session saw bears taking back the initiative. BTC dropped down to $38,600, losing 2.8 percent.
The weekend of April 30-May 1 started with another red candle on Saturday. Bitcoin closed the day at $37,600, below the long-term uptrend corridor. It also ended the month of April with a 17.4 percent loss.
On Sunday, the BTC/USDT pair climbed 2.4 percent up and ended the week right at the mentioned diagonal thus avoiding its invalidation.
What we are seeing midday on Monday is a second consecutive green candle on the daily chart.

ETH/USD
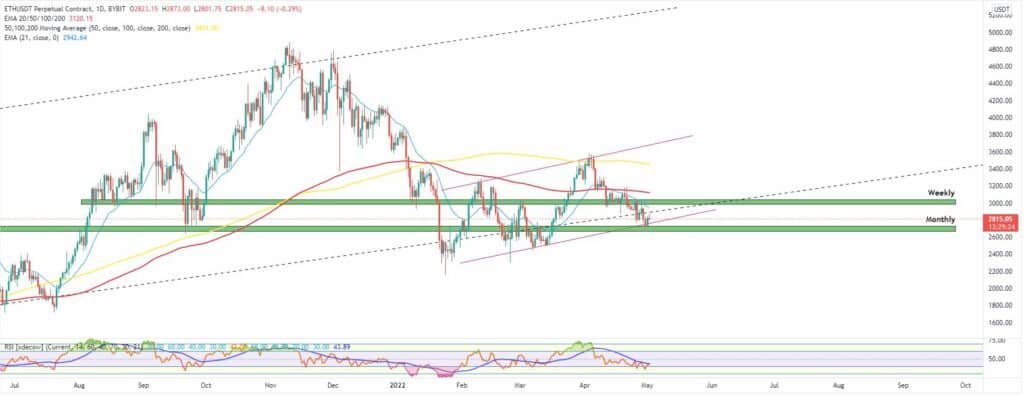
The Ethereum project token ETH closed the trading day on Sunday, April 24 at $2,920 and after a five-day-long losing streak, it found itself below the critical horizontal support around $3,000. The coin dropped 2.2 percent for the previous week and also lost the weekly timeframe support levels.
The ETH/USDT pair opened the new trading period on Monday by following all the way down to $2,793 for the first time since March 18. Buyers, however, absorbed the selling pressure and initiated an upside reversal which resulted in a full retrace. The ether closed the day at $3,000, close to the Volume Profile (VPVR) Point of Control zone.
The Tuesday session came as a shock to bulls. The leading altcoin crashed to $2,806 and lost the long-term uptrend corridor by losing 6.7 percent in a single day of trading.
The third day of the workweek saw ETH bouncing back from the mentioned lows. It jumped back above the diagonal support and ended the session with a 3 percent price increase.
On Thursday, April 28, the ether moved further up to hit $2,981 – right below the 21-day EMA and the old $3,000 horizontal support. Bulls however were rejected there and on the next day – Friday, the ETH/USDT pair fell all the way down to $2,815, which corresponded to a 4.2 percent decrease in price.
The first day of the weekend came with a re-visit of the next horizontal support at $2,700. Here we could also see the lower end of the big bear flag pattern as ETH was already trading below the long-term uptrend corridor.
The coin bounced from the mentioned levels and after ending the 30-day period with a 17 percent loss, added 4 percent on May 1.
The Ethereum token is currently trading at $2,815.

Leading Majors
- Solana (SOL)
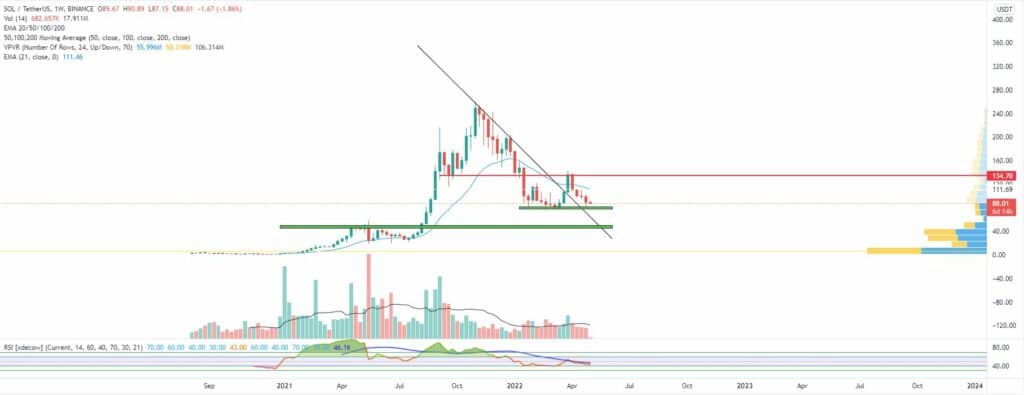
Solana is a chain we haven’t looked at in a long time. The once called “Ethereum killer” is underperforming in the last 6 months, but still remains in the Top 10.
In early March the SOL/USDT pair successfully jumped back up from the horizontal support near $80 and even managed to break above the 21-period EMA on the weekly chart and the diagonal downtrend line, but was stopped by bears at $145.
What we see now is another attempt from sellers to invalidate the multi-timeframe support which if successful will open the door for a re-visit of the zone around $45-$50 where the next most actively traded zone as per the Volume Profile Indicator (VPVR) is located.
On the other hand, if the support plays its role again, we can expect an attack of the $150 area, 65 percent above the current position of SOL.
The weekly chart is below.

Altcoin of the week
Our Altcoin of the week is Ethereum Name Service (ENS). This cryptocurrency protocol allows its users to buy and own their unique web3 username linked to an ERC-20 Ethereum address. The decentralized naming unlocks multiple use cases and makes it easier for users to navigate and interact with one another in the crypto world.
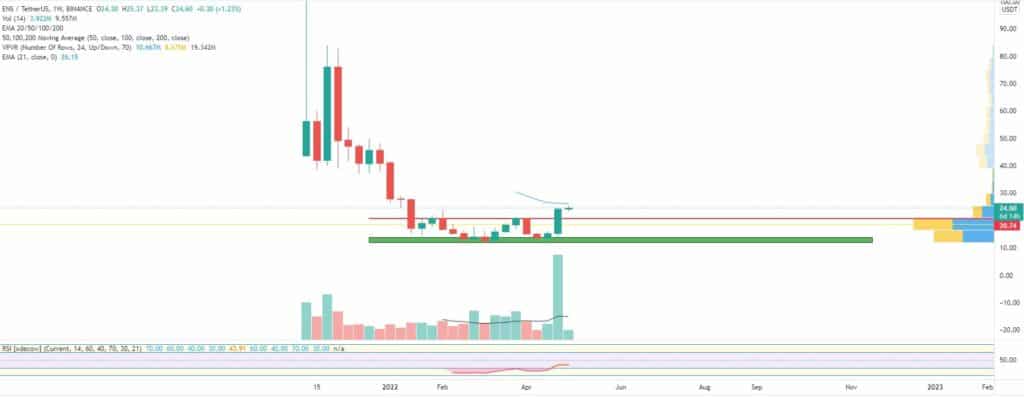
The ENS token was one of the few that ended the previous seven-day period in green. It added 59 percent to its valuation after bouncing back from the horizontal resistance near $14. The coin managed to surpass the daily timeframe resistance at $21 and is currently trading above $24.
The main reason for the recent surge in the price of ENS is the recently launched 4-digit domain names and the increased trading volume on the Opensea NFT marketplace.
The Ethereum Name Service is currently ranked at #131 on CoinGecko with a total market cap of approximately $570 million.
The weekly chart is below.


