Bitcoin, Ether, Major Altcoins – Weekly Market Update May 23, 2022

The total crypto market cap added $33 billion from its value over the last seven days and now stands at $1.37 billion. The top 10 coins were mostly in red for the same time period with Solana (SOL) and Cardano (ADA) being the worst performers losing 8 and 7.6 percent of losses respectively while Binance Coin (BNB) added 6.6 percent. Bitcoin (BTC) is currently trading at $29,920 while ether (ETH) is at 2,068.
BTC/USD
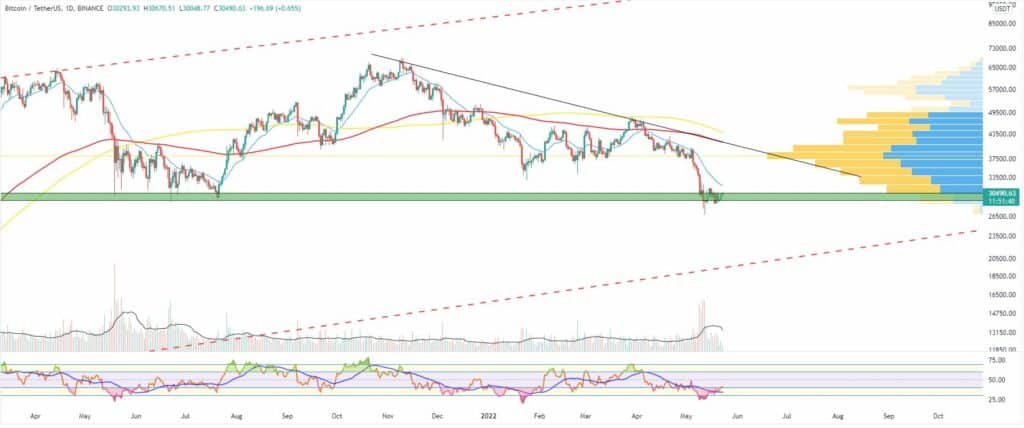
Bitcoin rallied all the way up to $31,400 and closed the week of May 9-15 with a 7.5 percent loss, but still 17 percent above its weekly low of $26,703. The Relative Strength Index (RSI) reached the 33 mark in the oversold zone for the first time since March 2020 on the bigger timeframe chart.
On Monday, May 16 the BTC/USDT pair dropped all the way down to $29,100 before closing the session at $29,850 erasing all gains from the previous day. The January 2021 and July 2021 bottoms once again were acting as a strong support/resistance area.
The biggest cryptocurrency jumped back up to $30,467 on Tuesday, but the bullish momentum was not on its side. We could clearly see the formation of a bear flag pattern on the 4-hour chart with the potential to push the price further down to the sub-$25,000 zone and somewhere near the 200-period EMA on the weekly chart.
The third day of the workweek came with another huge red candle, this time to $28,700 – below the already mentioned multi-timeframe horizontal support.
The 24-hour volumes were once again below their 14-day average value.
On Thursday, May 19, the BTC/USDT pair almost fully erased the losses from the previous session by climbing to $30,325 or 5.3 percent.
The Friday session was nothing out of the normal for the last few days as BTC remained caught in the main $29,000 – $31,000 range. It closed the day with a small red candle to$29,300.
The weekend of May 21-22 started with a relatively calm trading day on Saturday during which the leading cryptocurrency stayed close to the $29,400 level.
On Sunday, it once again started moving in an upward direction ending the week with a solid 2.5 percent daily candle.
As of the time of writing, BTC is trading slightly higher – at $30,405.

ETH/USD
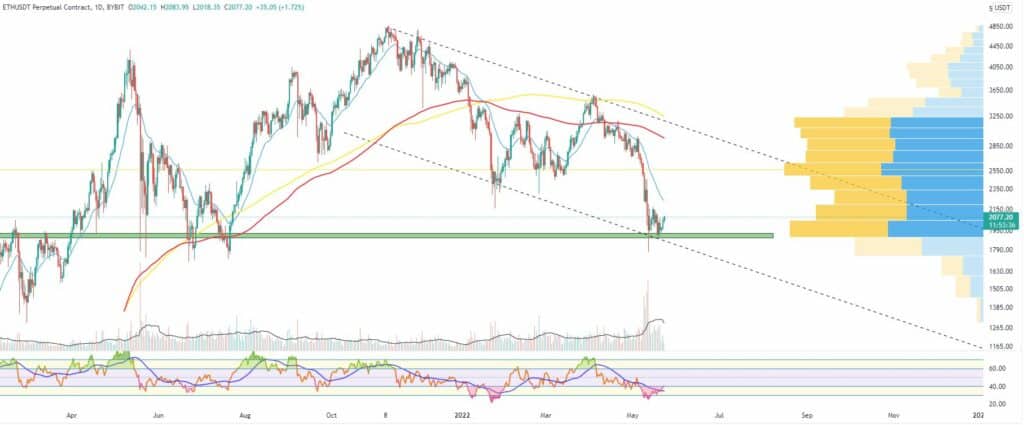
Bulls pushed the price of ETH up to $2,150 on Sunday, May 15 – a 21.5 percent growth since the coin bottomed at $1,778 on May 12. Still, it registered its sixth consecutive week in red, trading below most of the major support levels except for the long-term horizontal support above $1,700.
In terms of trading volumes, the ether was seeing values below the average for the last 14 sessions. The RSI indicator was at its lowest point since January 2022 on the daily timeframe chart.
On Monday, May 16 the ETH/USDT pair opened the new trading period by falling 5.6 percent down to the area around $2,026. It was forming a rising wedge bearish pattern on the lower-timeframe 4-hour chart where it was rejected on that day.
On Tuesday, May 17 it hit the lower boundary of the wedge bouncing up from it to close the day in green and at $2,090.
The mid-week session on Wednesday came with a successful break below the lower line of the mentioned figure and a 5.6 loss for the ETH token. Next major support (if $1,900 fails) is the $1,700-$1,750 zone.
On Thursday, May 19, the ether once again found support at the mentioned horizontal line and climbed all the way up to $2,018, which resulted in a 5.5 percent price increase.
It corrected the price down to $1,958 on Friday remaining in the current range and without general changes in the market trend.
The first day of the weekend came with a low volatility session during which the coin stayed flat.
Then on Sunday, it jumped up to the areа above $2,000, near the next most actively traded zone on the chart, setting the ground for a potential upside reversal.
The Ethereum token is currently trading at $2,066 on Monday morning in its third consecutive green day.

Leading Majors
- Binance Coin (BNB)
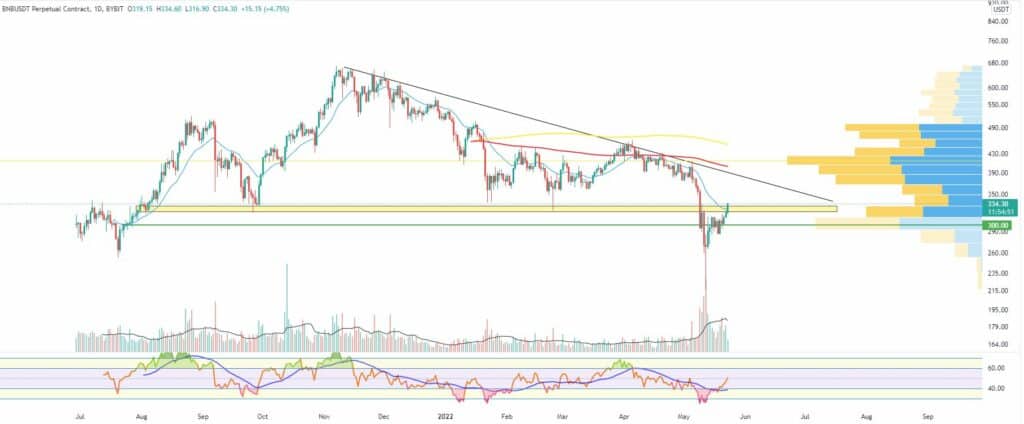
BNB was the only token on the Top 10 list to end the week in green. It increased by 2.2 percent and hit $322 after rallying 47 percent from the $215 bottom registered on May 12.
In general, the cryptocurrency exchange tokens outperformed the low cap assets in the fallout of the Terra ecosystem collapse as end-users looked out to them as a safe haven. Binance, the company behind the BUSD managed to keep its stablecoin unshaken by the recent events.
The BNB/USDT pair is currently trading above the 21-day EMA on the daily timeframe chart and close to the extremely important horizontal support/resistance in the $320-$330 area. Potential support at $300.

Altcoin of the week
Our Altcoin of the week is KuCoin Token (KCS). Previously known as KuCoin Shares, the native token of the KuCoin exchange was one of the best-performing digital assets in the last seven days.
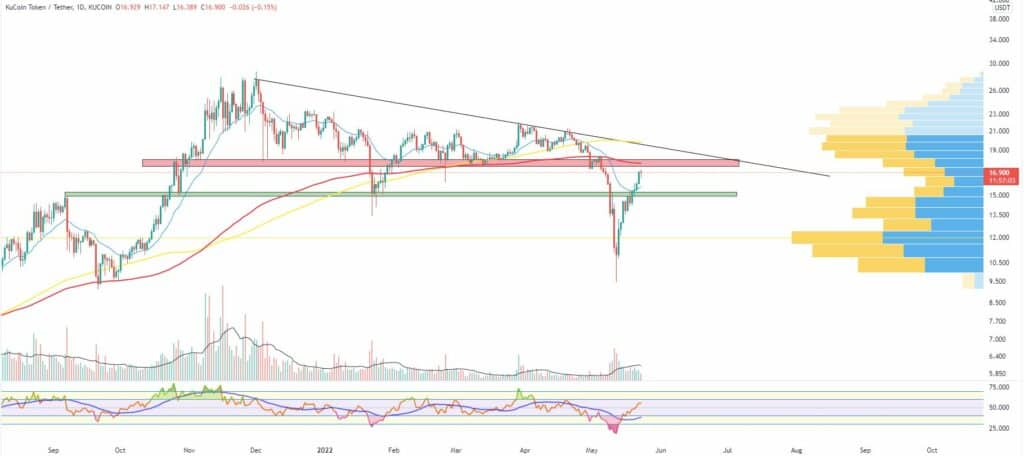
The KCS/USDT pair added 17 percent to its valuation during last week’s trading and is currently hovering around the $17 mark. It is also 78 percent up since May 12 when it registered a 7-month low by briefly hitting $9.4. Still, the coin quickly recovered in the aftermath of the Terra USD (UST) collapse and showed it hasn’t been impacted by the sudden market crash.
The recent rally in the price of KCS is most probably caused by a series of events in the last few weeks. First KuCoin raised $150 million at a $10 billion valuation to boost its Web3 development projects. Then the platform listed the newly launched Decentralized USD (USDD) coin on the Tron blockchain. Then there was also the Pikaster NFT project Token Sale on KuCoin Spotlight.
KCS is currently ranked at #47 on CoinGecko with a total market cap of approximately $1.61 billion.


