Bitcoin, Ether, Major Altcoins – Weekly Market Update May 24, 2021

The total crypto market cap erased $521 billion of its value for the last seven days and now stands at $1,497 billion. The top 10 coins were all in red for the same time period with all of them posting double-digit losses. Polkadot (DOT) was the worst performer with a 54 percent decline in value. Bitcoin (BTC) is currently trading at $36,500, ether (ETH) is at $2,260.
BTC/USD
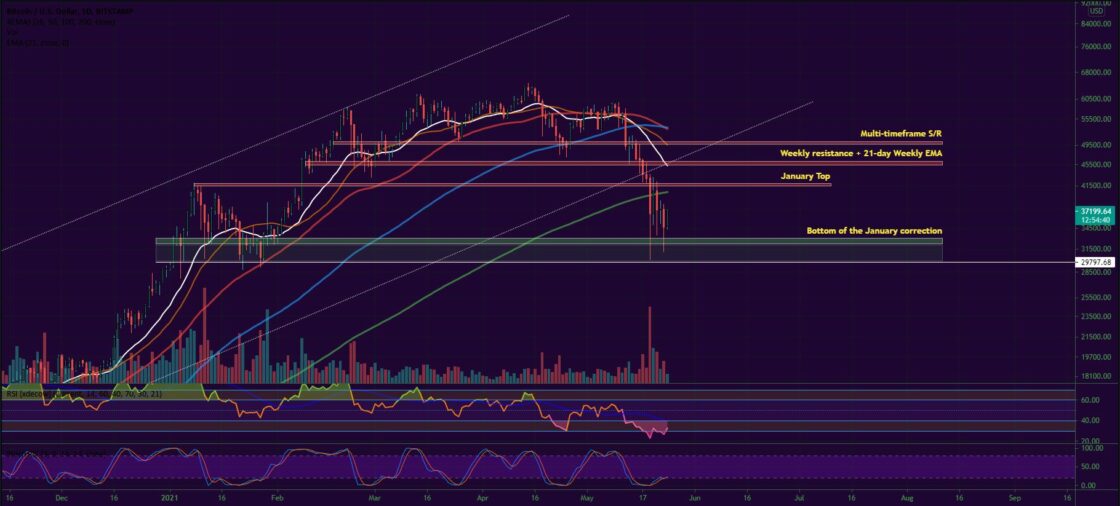
Bitcoin closed the trading session on Sunday, May 16 at $46,420 after trading in the wide range between $49,600 and $43,800 during intraday. It was 20 percent down on a weekly basis.
On Monday, the biggest cryptocurrency broke below the 21-day EMA on the weekly timeframe and hit the lower boundary of the long-term uptrend corridor, closing the day near $43,600, which corresponded to a 6 percent decline.
The Tuesday session was the fourth consecutive in red for BTC. This time the coin temporarily recovered to $45,500 but was rejected there, proving that the zone has turned from support to resistance, thanks to the weekly levels. Bears managed to push the price down to $42,800 at the candle close.
The mid-week session on Wednesday was no different and bitcoin continued to slide, moving below the January high of $42,000 and briefly touching the sub-$30k zone. It ended the day at $36,800 – its lowest point since February 3, 2021.
On Thursday, May 20 the BTC/USDT pair partially covered some of the losses by moving up to $40,565. The coin added 9.8 percent to its value and was temporarily trading above the mentioned $42,000 mark which was now expected to turn into resistance.
The last day of the workweek came with another volatile session on the cryptocurrency market. Bitcoin was trading in the $42,2300 – $33,600 area before falling further to $37,320 in the later hours of the day.
The market took another blow from China’s financial regulators which announced additional plans for a crackdown on the cryptocurrency mining activities in the country in addition to the already imposed trading and payment restrictions.
On the first day of the weekend the biggest cryptocurrency remained flat, but still dangerously close to the important potential support zone and weekly low at $32,000-$30,000. The main trend strength indicators were already pointing to an exhaustion of the downtrend.
On Sunday, May 23, however, BTC nosedived to $31,100 and re-tested the mentioned support, being more than 15 percent down for the day at one point. Still, some large buy orders were triggered around the bottom of the January correction, which helped BTC to end the week at $34,600.
What we are seeing on Monday morning is an increasing buying volume and a green wave that pushed BTC up to $36,500 at the time of writing.

ETH/USD
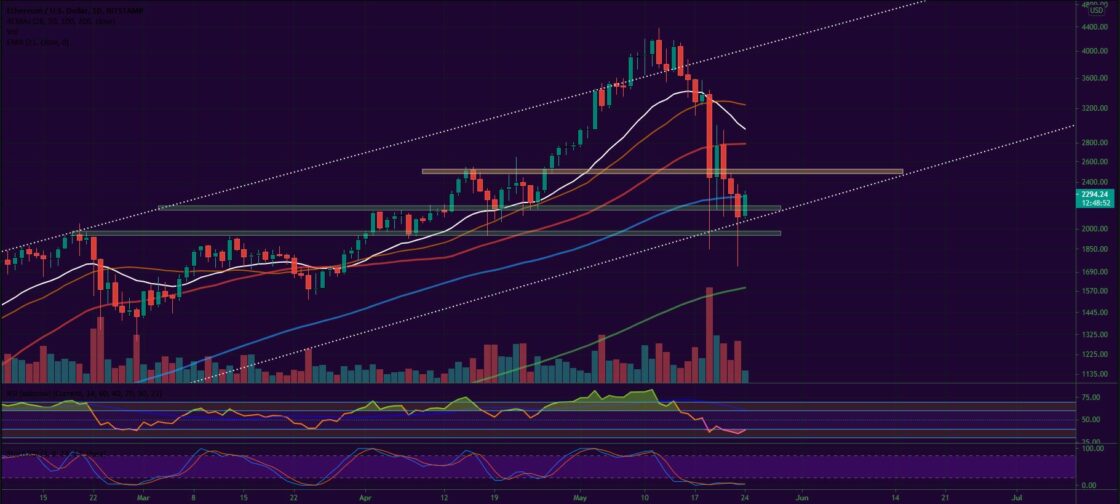
The Ethereum Project token ETH was highly volatile on the last day of the previous week. It was moving up and down the zone between $3,860 and $3,340 before closing with a red candle at $3,580 – below the previous uptrend line, but still above the horizontal support.
The ether was 9 percent down for the seven-day period.
On Monday, the coin continued to move downwards and erased another 8 percent, lost the 21-day EMA, and reached $3,280.
The overall market decline affected the previously unstoppable ETH bulls and they started losing ground. The mentioned $3,500 support turned into resistance, which was normal given the fact it was only tested once in the current run. The Tuesday session was not that good for buyers as they were rejected at the horizontal level and only managed to form a short green candle to $3,370.
The third day of the workweek came with a flash crash. The ETH/USDT pair dropped as low as $1,845, which corresponded to a 45 percent decline, but recovered in the latter part of the session, eventually closing at $2,455.
On Thursday, May 20, the coin’s price was again unstable, initially falling to $2,160, testing the support level than climbing up to the 50-day EMA on the daily chart near $2,753.
The Friday session was a continuation of the downward movement. The ether closed at $2,435 but not before hitting again the mentioned support at some point during intraday trading.
The weekend of May 22-23 came with a second consecutive day in red on Saturday when the ETH token made one step down and touched $2,230.
Then on Sunday, it dropped as low as $1,715 for the first time since March but quickly jumped back into the uptrend corridor.
At the beginning of the new week, the ETH/USDT pair reclaimed the $2,200 support and is now trading 9 percent higher.

Top 10
- Binance Coin (BNB)
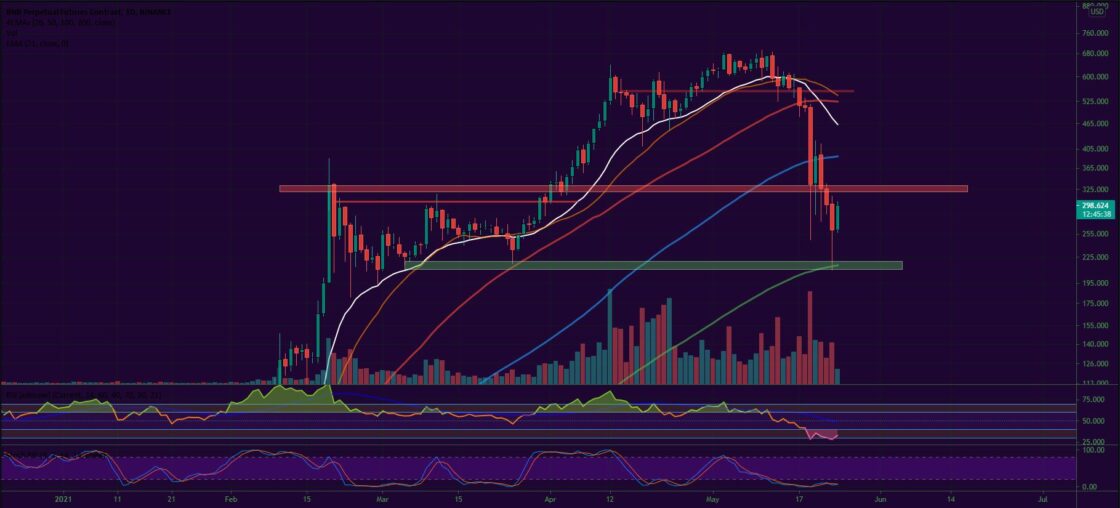
The Binance exchange native token BNB was one of the worst performs among the leading cryptocurrency projects erasing 54 percent of its market cap on a seven-day basis.
The coin was already heading South thanks to the rising interest in Layer 2 solutions like Polygon. The platform was seen by many as an improvement to the Ethereum blockchain fee’s structure, but with better security compared to the Binance Smart Chain.
Additionally, some of the biggest yield aggregators on BSC – Pancake Bunny, Venus and Bogged Finance were all exploited leading to massive losses and a severe selloff of their respective tokens.
The next level of support for the BNB/USDT pair is the $220-$210 zone – a solid range from the February-March 2021 period.

Altcoin of the Week
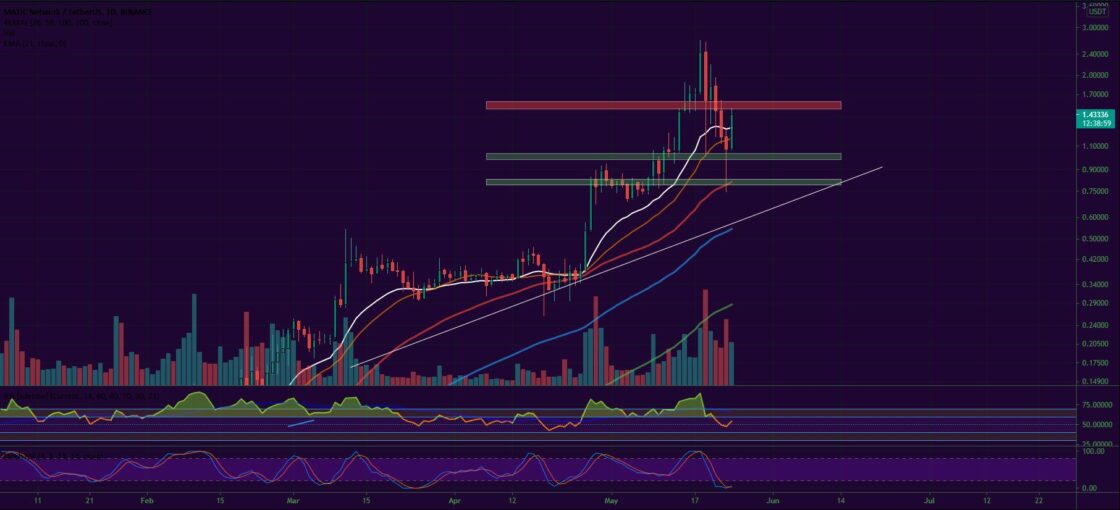
Our Altcoin of the week once again is Polygon (Matic). The leading Layer 2 solution registered a new all-time high on Tuesday, May 18 by hitting $2.7, but closed the previous seven-day period 61 percent below that mark.
The coin temporarily surpassed the Ethereum blockchain in terms of daily transactions and continued to attract more and more established projects to its ecosystem.
The $0.75-$0.85 area acted as strong support on Sunday afternoon, which triggered a solid reversal to the upside.
The MATIC/USDT pair is currently trading at $1.42 or 89 percent higher compared to yesterday’s low.


