Bitcoin, Ether, Major Altcoins – Weekly Market Update September 12, 2022

The cryptocurrency market added $98 billion to its market cap during the last seven days and now stands at $1,070 billion. The top 10 coins were all in green in the same time period with Solana (SOL) and Bitcoin (BTC) being the best performers with 17.7 and 10.8 percent of gains respectively. Bitcoin (BTC) is currently trading at $22,250 while ether (ETH) is at 1,753.
BTC/USD
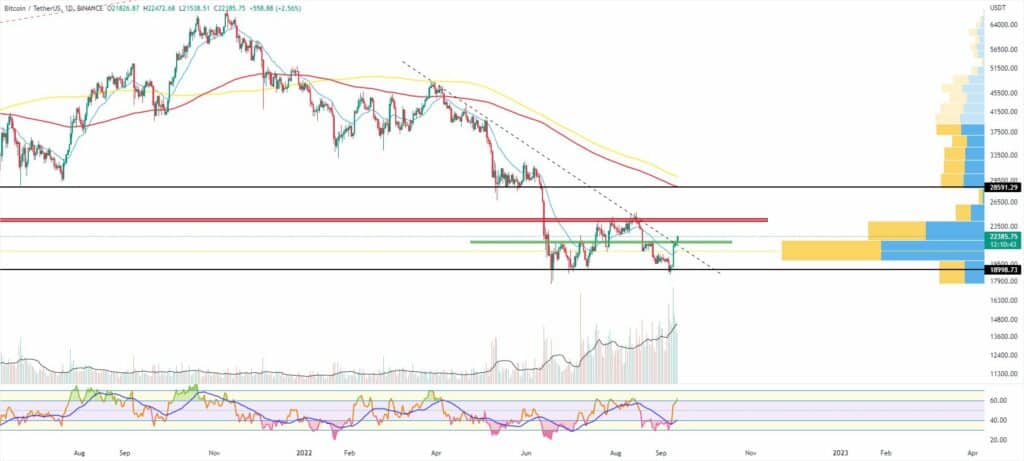
Bitcoin closed the trading day on Sunday, September 4 at the psychological level of $20,000 after trading in the $19,800 – $20,150 range for four consecutive days.
It was clear from the price action on the bigger time-frames that the leading cryptocurrency was about to re-test the major horizontal support below $19,500 in the short term.
On Monday, the BTC/USDT pair erased all gains from the previous day and dropped down to $19,800, or 1 percent lower.
The range low was finally broken on Tuesday when bears pushed the price all the way down to $18,800 which corresponded to a 5 percent decrease. The coin closed at its lowest point since December 2020, surpassing the June, 18 low. It also created a relatively big fair value gap on the daily timeframe chart.
The price touched $18,500 in the early hours of trading on Wednesday. The mid-week session, however, turned out to be quite good for buyers as BTC made a quick bounce to $19,330.
On Thursday, September 8, the coin remained flat, hovering near the last daily candle close.
The Friday session came with a huge upward continuation. Buyers managed to consolidate and the price of bitcoin skyrocketed up to $21,440 adding 10 percent on its best day since February 28, 2022. It climbed above the 21-day EMA and hit the mid-term diagonal resistance on the daily chart.
The weekend of September 10-11 started with a green candle on Saturday during which we saw the price trying to break above the $21,500-$22,000 resistance. It remained below it but still, the buying pressure was obvious.
On Sunday, the BTC/USDT pair was not that volatile but still managed to form a short green candle to jump above the diagonal line.
What we are seeing midday on Monday is a strong bullish momentum with the price trading above $22,000.
Trading volumes increase significantly in the last few days, surpassing the 14-day average. The Relative Strength Index (RSI) went out of the oversold area to reach its midpoint. An uptrend continuation in the next few weeks cannot be excluded although we might see a pullback to fill the value gap created on the daily chart.
ETH/USD
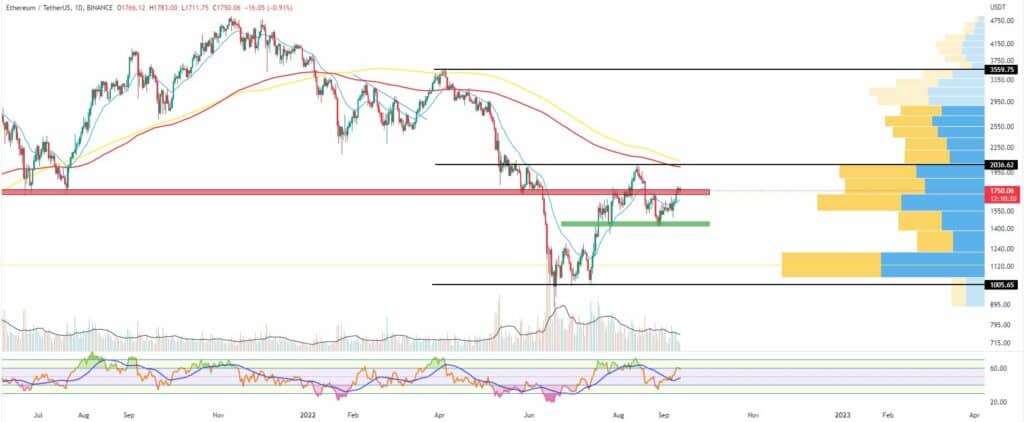
The Ethereum Project token ETH closed the previous week with a 13 percent increase after completing its bull flag consolidation on the weekly timeframe chart. It was now in its second week of gains with more upside expected right before and after the Merge (transition to Proof of Stake consensus mechanism) on September 14.
The Sunday, September 4 session ended at $1,580, after the coin successfully bounced back from the zone around $1,400.
On Monday, the ETH/USDT pair climbed up to $1,620 on its second day in green.
On the next day, however, it first peaked at $1,690 in the morning then quickly fell back to close in red at $1,558 and with a 3 percent loss.
The third session of the workweek brought extreme volatility. The ether was moving up and down the $1,657 – $1,489 range before forming a huge 4.7 percent green candle to surpass the 21-EMA and stop at $1,628.
On Thursday, the popular altcoin remained flat above the mentioned dynamic trend indicator in a possible consolidation before the next leg up.
What we saw on Friday was a continuation of the uptrend. ETH rallied 5 percent up to reach the resistance zone above $1,700.
The first day of the weekend came with a fourth consecutive day in green as the ether reached $1,780 adding 3.5 percent more to its value.
On Sunday it took a break as it was unable to continue with the rapid growth.
As of the time of writing this market update the ETH/USDT pair is trading in red – at $1,750.
Leading Majors
- Solana (SOL)
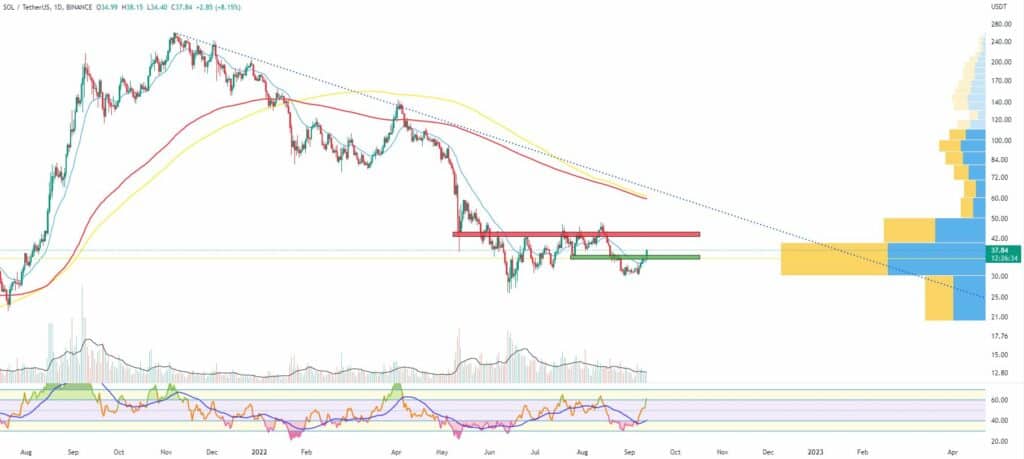
Solana had been trading in the $30-$33 range for 10 days straight before it managed to break out of it on September 7. The coin rallied more than 13 percent last week to reach the area near $35 in something similar to a reversed Bart Simpson pattern on the daily chart.
The price rally continues on Monday as SOL is currently trading above $37.
The trading volumes were in a constant decline since mid-June while RSI remained oversold for a while.
Bulls managed to surpass quickly the potential short-term resistance above the 21-day EMA around $35 opening the door for the next big obstacle in front of them on both daily and weekly timeframes.
– the $43-$46 zone.
Potential short-term support at $35.
Altcoin of the week
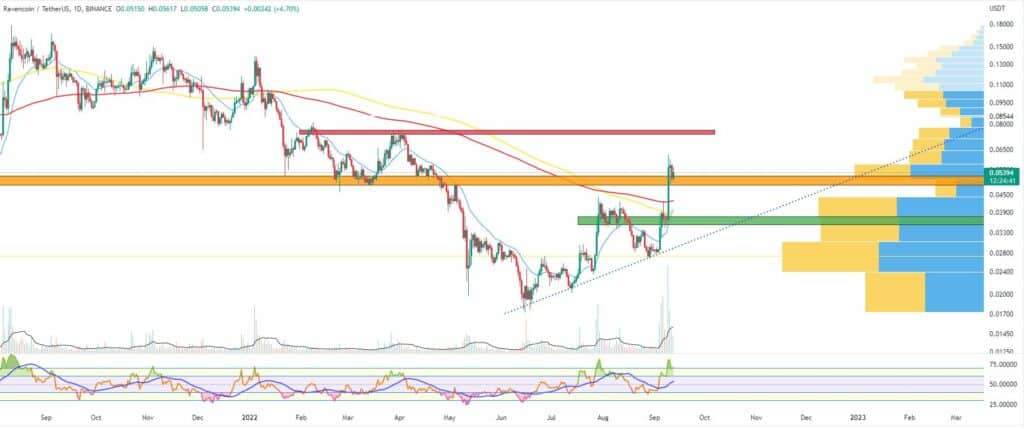
Our Altcoin of the week is Ravencoin (RVN) – a free and open-source asset management protocol with a relatively big following in the industry. This popular Proof of Work (PoW) coin is a fork of Bitcoin and became popular among cryptocurrency miners during the 2017/2018 bull run.
Now RVN is looking to fill the void that ETH will leave in the cryptocurrency mining world after its long-awaited transition to Proof of Stake (PoS) becomes reality on September 14.
The RVN/USDT pair rallied 47 percent during the last seven days to reach the $0.052 mark at the weekly candle close. It is 200 percent up since hitting a 72-week low in the middle of June.
The altcoin is currently trading at a multi-timeframe resistance in the $0.048-$0.052 zone, so we can expect a slight pullback before and after the Merge before the next leg up.
Support, right below the 21-week EMA, near $0.035.
Ravencoin is currently ranked at #84 on CoinGecko, with a total market cap of $612 million.
