Bitcoin, Ether, Major Altcoins – Weekly Market Update September 5, 2022

The cryptocurrency market added $20 billion to its market cap during the last seven days and now stands at $973 billion. The top 10 coins showed mixed results for the same time period with Cardano (ADA) adding 12.7 percent while BNB lost 1.3 percent. Bitcoin (BTC) is currently trading at $19,715 while ether (ETH) is at 1,566.
BTC/USDT
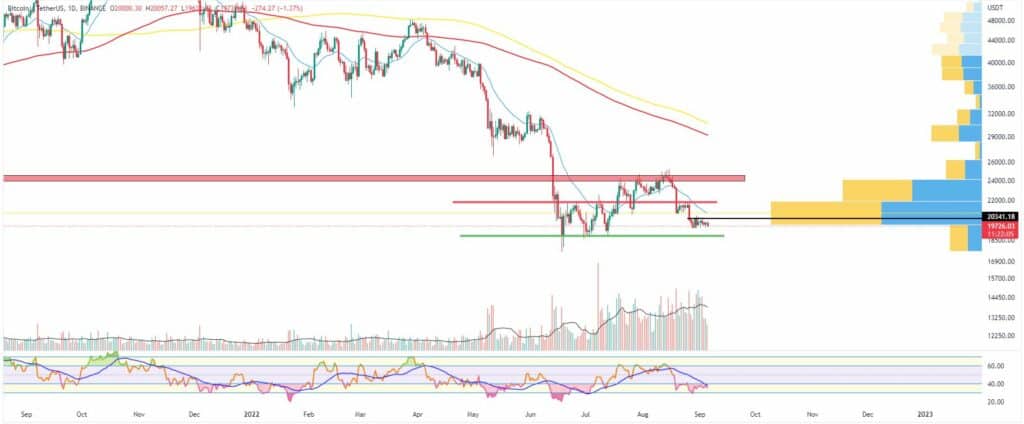
Bitcoin closed the trading day on Sunday, August 28 at $19,550 after a three-day losing streak during which it erased more than 9 percent of its market cap. The biggest cryptocurrency was very close to re-testing the last weekly candle close low near $19,300.
On Monday, August 29 bulls started the new seven-day period by pushing the price up to $20,270 or 3.6 percent higher in an obvious short squeeze attempt.
The Tuesday session was slightly different. The BTC/USDT pair rallied in the morning to hit $20,600 only to see a full retracement of the move and a daily candle close in red.
The mid-week trading day on Wednesday came with another breakout attempt in the upward direction, which again resulted in a failure. Still, bulls were able to ensure a short, 1.3 percent increase to color the market in green.
Bitcoin ended the month of August with a 14 percent price decrease in what was dangerously close to resulting in a bearish engulfing pattern on the monthly chart.
It is quite possible we see a re-test of the horizontal support on both the weekly and daily timeframes – an event that could lead to either a reversal to the upside or a break of the current market structure which will open the door for re-visiting the next major order block around $12,000.
On Thursday, September 1, the BTC/USDT pair fell to $19,547 in the morning but managed to partially recover in the afternoon and closed in green at $20,100.
Bitcoin rallied on Friday to reach $20,448, but could not keep up with the momentum and eventually closed in red, at $19,556. The trading range was narrowing with every session.
The weekend of September 3-4 started with a second consecutive day in red on Saturday. Then on Sunday, the biggest cryptocurrency once again tested the $19,500 level, but then turned green and ended the seven-day period at $20,000.
What we are seeing midday on Monday is another red session as BTC is trading below $19,700.

ETH/USDT
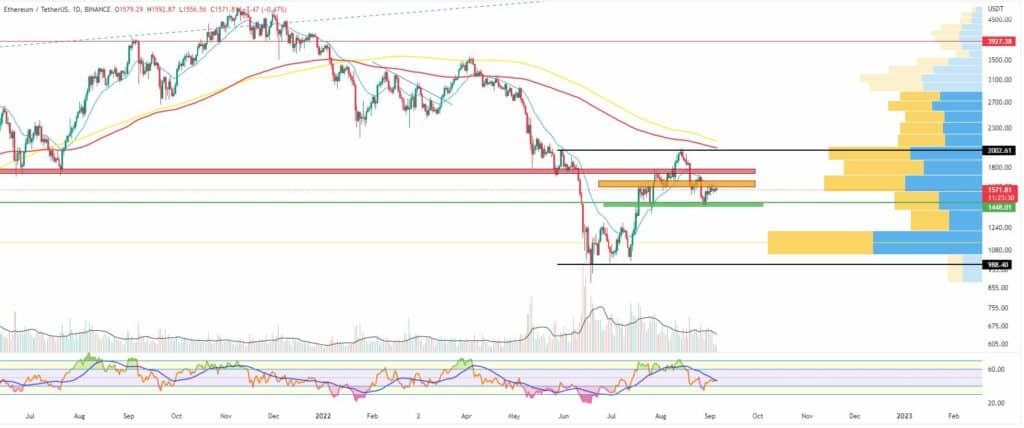
The Ethereum Project token ETH was in a bull flag consolidation on the weekly chart ever since it was rejected at the 21-period EMA on that timeframe above $1,900. The ether, however, managed to form a higher low on the weekly chart that could push the price higher before the “Merge” (the ETH network transition from Proof of Work consensus mechanism to Proof of Stake).
On Sunday, August 28, the ether closed in red, at $1,425 losing 12 percent on a weekly basis. The short-term diagonal on the daily chart was still acting as a resistance.
On Monday, the ETH/USDT pair rallied all the way up to $1,556 to fully engulf the last two days of intense selloff by adding 9 percent to its market cap.
Bulls, however, were rejected at the mentioned diagonal around $1,600 on Tuesday and the leading altcoin corrected its price down to $1,522 – still above the daily low of $1,480.
On the last day of August, we saw another failed breakout attempt. ETH ended the last 30-day period with a 7 percent loss.
It was a relatively calm session on Thursday, September 1 as the price was trading as low as $1,515 before turning green in the evening, closing at $1,590.
The potential Double Top formation on The US Dollar Index could put some pressure on its general uptrend in the mid-term and allow the crypto market (and all other risk assets) to continue their bear market rallies.
On Friday, the ETH/USDT pair climbed all the way up to $1,645 marking a local top, and then quickly came back down to $1,576 at the candle close.
The first day of the weekend came with a second consecutive day in red and a test of the $1,535 mark. Then on Sunday, we saw a push from bulls to $1,585 to end the week in green.
As of the time of writing, ETH is trading at $1,573.

Leading Majors
- Cardano (ADA)
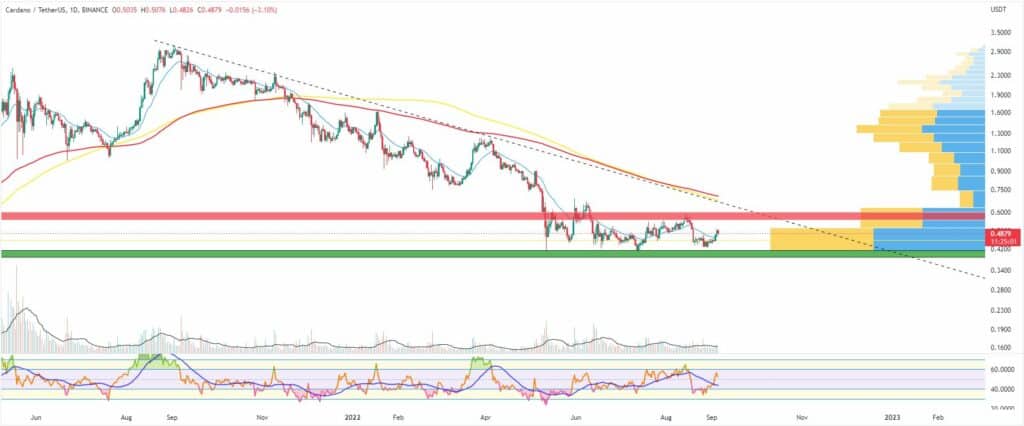
One of the most popular altcoins out there, ADA bounced back up strong from the horizontal support around $0.40 in the last week.
It rallied more than 18 percent to climb above the 21-day EMA.
The ADA/USDT pair was trading in the $0.40-$0.55 range since June 12 but the news about the new date of the Vasil hardfork drastically changed the price action in the last few days. The big milestone will occur on September 22, 3 months after the initially planned date. Still, the market reacted positively and the ADA token ended up being the best-performing digital asset in the Top 10 list.
Next for the “Ethereum killer app” is the upper end of the range – $0.55, above the 200-period EMA on the weekly timeframe chart.
Support at $0.45.

Altcoin of the week
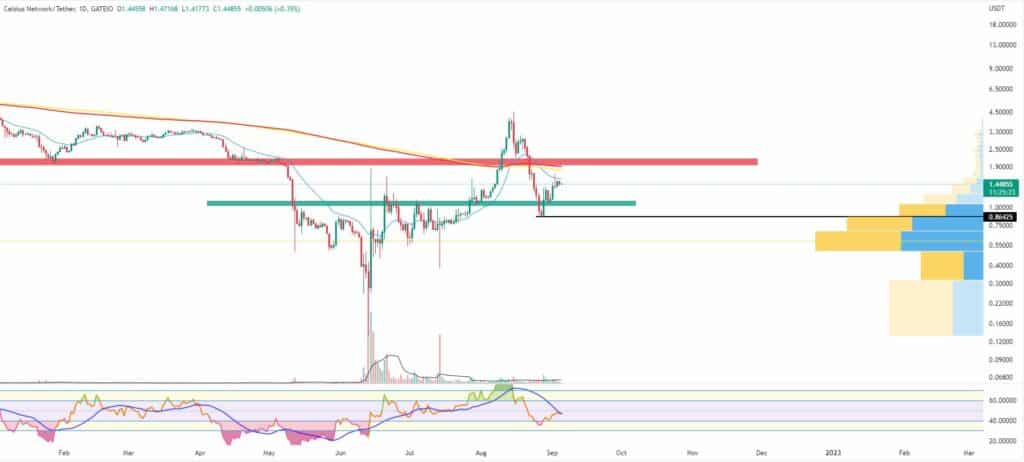
Our Altcoin of the week is Celsius Network (CEL). The troubled lender protocol rallied 28 percent during the last seven days to reach the zone right below the 21-day EMA on the daily timeframe chart. The coin is also 70 percent up since hitting its last higher low at $0.855.
Celsius limited all user withdrawals in late June as a direct result of the severe market crash that hit particularly hard the more centralized DeFi platforms. It filed for bankruptcy the next month.
The latest news from the company however suggests they aim to return approximately $50 million of locked funds hence the price rally.
If the 21-EMA, which is currently sitting above the $1.6 mark is successfully surpassed by bulls then the next major resistance is at the previous horizontal support near $2.
Support at $1.
The Celsius Network token is currently ranked at #76 on CoiNGecko with a total market cap of approximately $616 million.


