Bitcoin’s MVRV ratio nears key level — Is a BTC breakout ahead?


Bitcoin is showing signs of gathering strength after a week of sideways movement, with two key on-chain indicators hinting at a potential breakout.
- Bitcoin’s MVRV ratio is converging toward its 365-day MA, a pattern historically followed by rallies.
- The futures market shows signs of cooling, suggesting a healthier, less speculative BTC rally.
- Technical indicators show consolidation near support, with a potential breakout brewing.
In a July 31 analysis, CryptoQuant contributor CoinCare pointed to the Market Value to Realized Value ratio, which currently sits at 2.2 and is converging toward its 365-day moving average. Historically, such periods of convergence have often preceded Bitcoin (BTC) rallies, as the metric tends to climb toward overvaluation zones near 3.7.
The setup, CoinCare notes, is akin to how stock prices don’t hover around long-term moving averages for long before making a decisive move.
Bitcoin futures market cools
A separate July 30 analysis by CryptoQuant analyst ShayanMarkets highlighted a cooling trend in the Bitcoin futures market. Despite BTC trading near $123,000 recently, the volume bubble map shows a shift away from overheated red zones into more neutral and cooling regions.
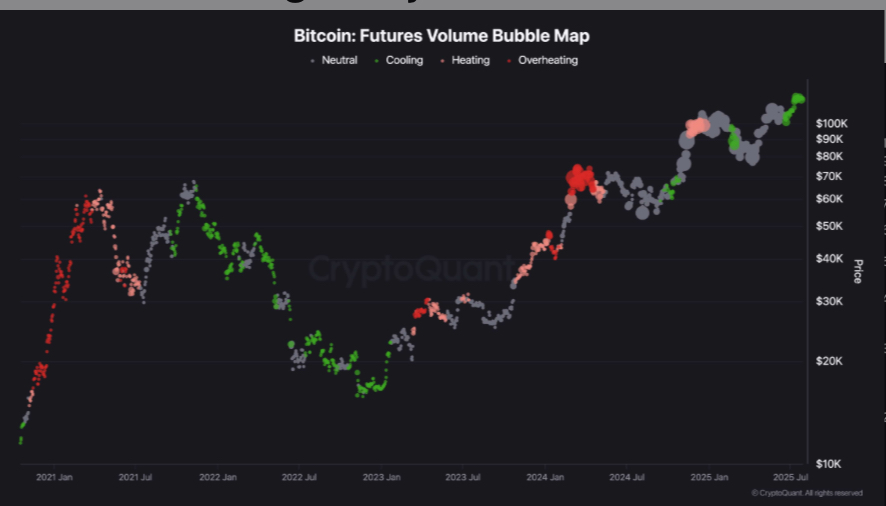
Bitcoin’s steady ascent above $100,000 and this reversal in speculative activity point to the market being driven more by natural demand than by excessive leverage, which could pave the way for a fresh bullish trend.
With a seven-day range of $115,184-$119,568, Bitcoin is trading at $118,313 at the time of writing, up 0.1% for the day. Although it’s still down 3.7% from its July 14 all-time high of $122,838, it remains up 10% over the past month, indicating resilience during the recent consolidation phase.
Bitcoin technical analysis
On the daily chart, Bitcoin is hugging the 20-day Bollinger Band middle line, which is currently around $118,327, indicating moderate bullish pressure. The bands themselves have narrowed in recent sessions, indicating reduced volatility and the potential for a breakout as compression often precedes expansion.
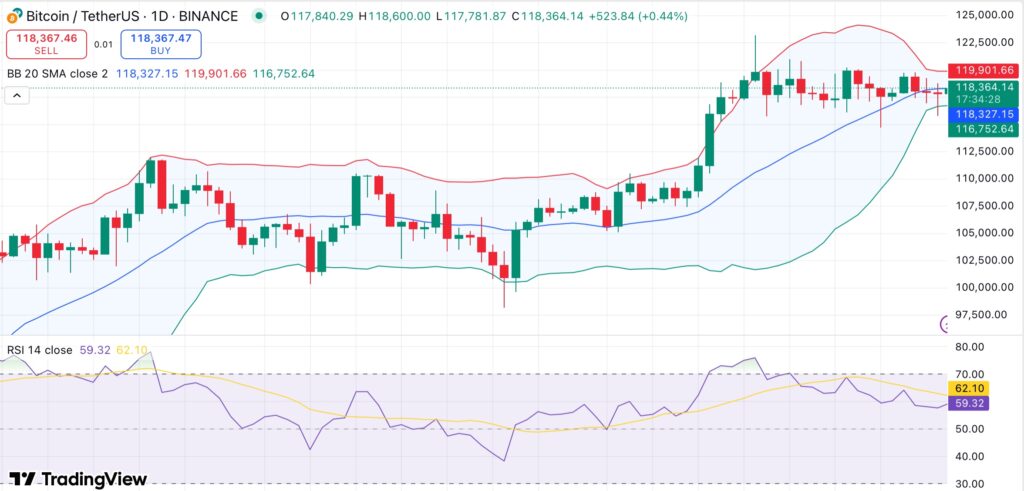
The relative strength index is neutral at 59.32. Although it is not yet in overbought territory, it still shows some bullish momentum. Bitcoin’s next move might depend on its capacity to overcome the $119,900 barrier, which is the upper edge of its Bollinger Band.
If this level is cleared, there may be a chance for a fresh rally and a move above $123,000. On the flip side, a breakdown below $116,700, the lower band boundary, would invalidate the current bullish structure and open the door to a deeper correction.