Bitcoin plummets 10% in 10 days: Learn how to spot the next crash

How often have you seen Bitcoin plummet unexpectedly, just an hour or a day after buying a fresh stack? Everyone has faced this frustration, wondering, “If only I knew, I would have bought it later for cheaper.” The good news is that some indicators can help predict these downturns.
While some indicators, like the MVRV Z-score and the Pi Cycle Top, help identify market tops, they do not provide insights into short-term downward movements. This is where the on-chain trader realized price comes into play.
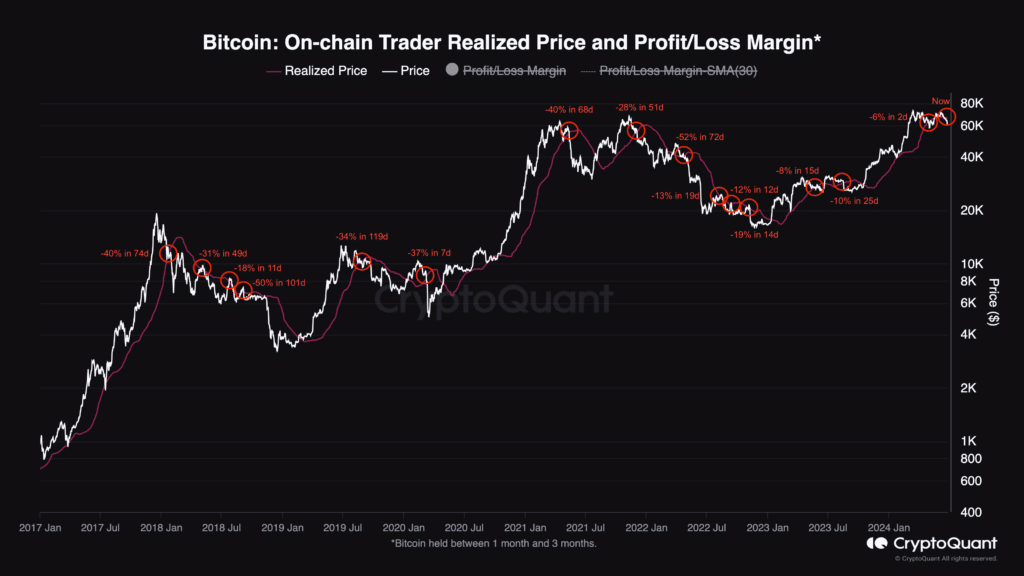
The on-chain trader realized price graph highlights a clear pattern in Bitcoin’s price movements from 2018 to 2024. Every time Bitcoin’s price falls below the on-chain trader realized price, it tends to drop further. On average, the price plummets -27% within 43 days.

Additionally, the realized price often serves as a dynamic support or resistance level. When Bitcoin’s price approaches this line from above, it sometimes bounces back up, using it as support. Conversely, when the price crosses below the realized price, it often fails to break through and declines further, using the line as resistance.
To understand why the realized price is such a powerful indicator, it’s important to grasp its underlying concept. The realized price represents the average price at which all current Bitcoin holders acquired their coins. When the market price falls below the realized price, it indicates that many holders are sitting on unrealized losses, which can create selling pressure and lead to further price declines.
Traders can use the realized price as a benchmark to predict potential downward movements. By closely monitoring when Bitcoin’s price crosses the realized price, traders can anticipate periods of heightened selling pressure and prepare accordingly.
But the question may arise: If one knows that Bitcoin will fall, when should one buy back in?
First of all, one must understand that consistently selling at the top or buying at the bottom is nearly impossible. A trader might get lucky once, but repeating this feat consistently is improbable; otherwise, many would become very rich very quickly. However, one can analyze the price structure on the on-chain realized price graph. When Bitcoin’s price ceases to decline and begins to show an upward trend, it indicates a potential buy-back opportunity.
The Moving Average Convergence Divergence (MACD) can clearly reveal both the downward and upward trends. MACD is a tool that helps traders understand if the price of an asset is likely to go up or down. It uses two lines: the MACD line and the signal line. When the MACD line goes above the signal line, it might be a good time to buy. When it goes below the signal line, it might be a good time to sell. MACD also features red and green bars, known as the histogram, which represent the difference between the MACD line and the signal line. Green bars indicate increasing bullish momentum, while red bars indicate increasing bearish momentum.
By using the on-chain trader realized price and MACD in tandem, traders can gain valuable insights into Bitcoin’s price movements. The combination allows traders to identify potential downward trends with high probability and anticipate the best times to re-enter the market.


