Bitcoin price rises toward $95K resistance — is this crucial ratio flashing a warning?


Bitcoin price climbed toward the $95,000 even as risk-adjusted returns continued to weaken.
- Bitcoin price is up 7.5% this week but remains well below its September peak.
- Trading and derivatives volume are rising faster than open interest.
- A falling Sharpe ratio suggests the rally lacks strong risk-adjusted support.
Bitcoin traded at $93,810 at press time, up 1.4% over the past 24 hours, as the price continued to move toward the $95,000 resistance area. The leading cryptocurrency remains about 25% below its September peak at $126,080.
The recent recovery has lifted prices 7.5% over the past week and 4.5% over the last 30 days. Trading activity increased alongside the move. Bitcoin’s (BTC) 24-hour volume rose 33.8% to $50.58 billion, suggesting more participation as the price pushed higher.
Derivatives data from CoinGlass shows a similar pattern. Derivatives volume climbed 43% to $85 billion, while open interest rose 2.56% to $61 billion.
Volume expanding faster than open interest often points to active positioning and rotation, rather than aggressive leverage buildup.
Sharpe ratio highlights weakening risk efficiency
According to a Jan. 6 analysis by CryptoQuant contributor BorisD, Bitcoin’s Sharpe ratio is showing an unusual structure. While price is moving higher, the 1-year return remains negative, and the Sharpe ratio itself continues to decline.
In past cycles, strong moves were accompanied by rising Sharpe ratios, reflecting efficient returns relative to volatility. At market lows, volatility tended to compress as returns bottomed.
The current setup looks different. Volatility is rising, but returns are not improving at the same pace. From a risk-adjusted view, the move higher appears uneven.
Rather than being supported by sustained demand, the advance seems driven by positioning and short-term flows. This kind of behavior often shows up when the market is testing its next direction instead of committing to a clear trend.
Market cycle indicators point to cooling, not capitulation
A separate analysis from CryptoZeno suggests that the current environment looks more like a cooling phase. The Bull–Bear market cycle indicator has rolled over after reaching elevated levels, pointing to slowing upside momentum.
So far, the indicator hasn’t pushed into the deeply negative zone that typically signals capitulation. Longer-term trend measures, meanwhile, are still holding above levels that defined prolonged bear markets in earlier cycles.
On-chain data tells a similar story. Long-term holders continue to act with stability, while short-term participants are beginning to see their profitability erode. That combination is common during consolidation phases, where volatility rises but conviction weakens.
Bitcoin price technical analysis
From a technical standpoint, Bitcoin is attempting to rebuild structure after a sharp pullback. The price has once again surpassed the 10-day and 50-day moving averages, which are now all pointing upward.
BTC is still trading below the 100-day and 200-day moving averages, which are between $96,000 and $106,000 and continue to limit rallies, despite recent gains.
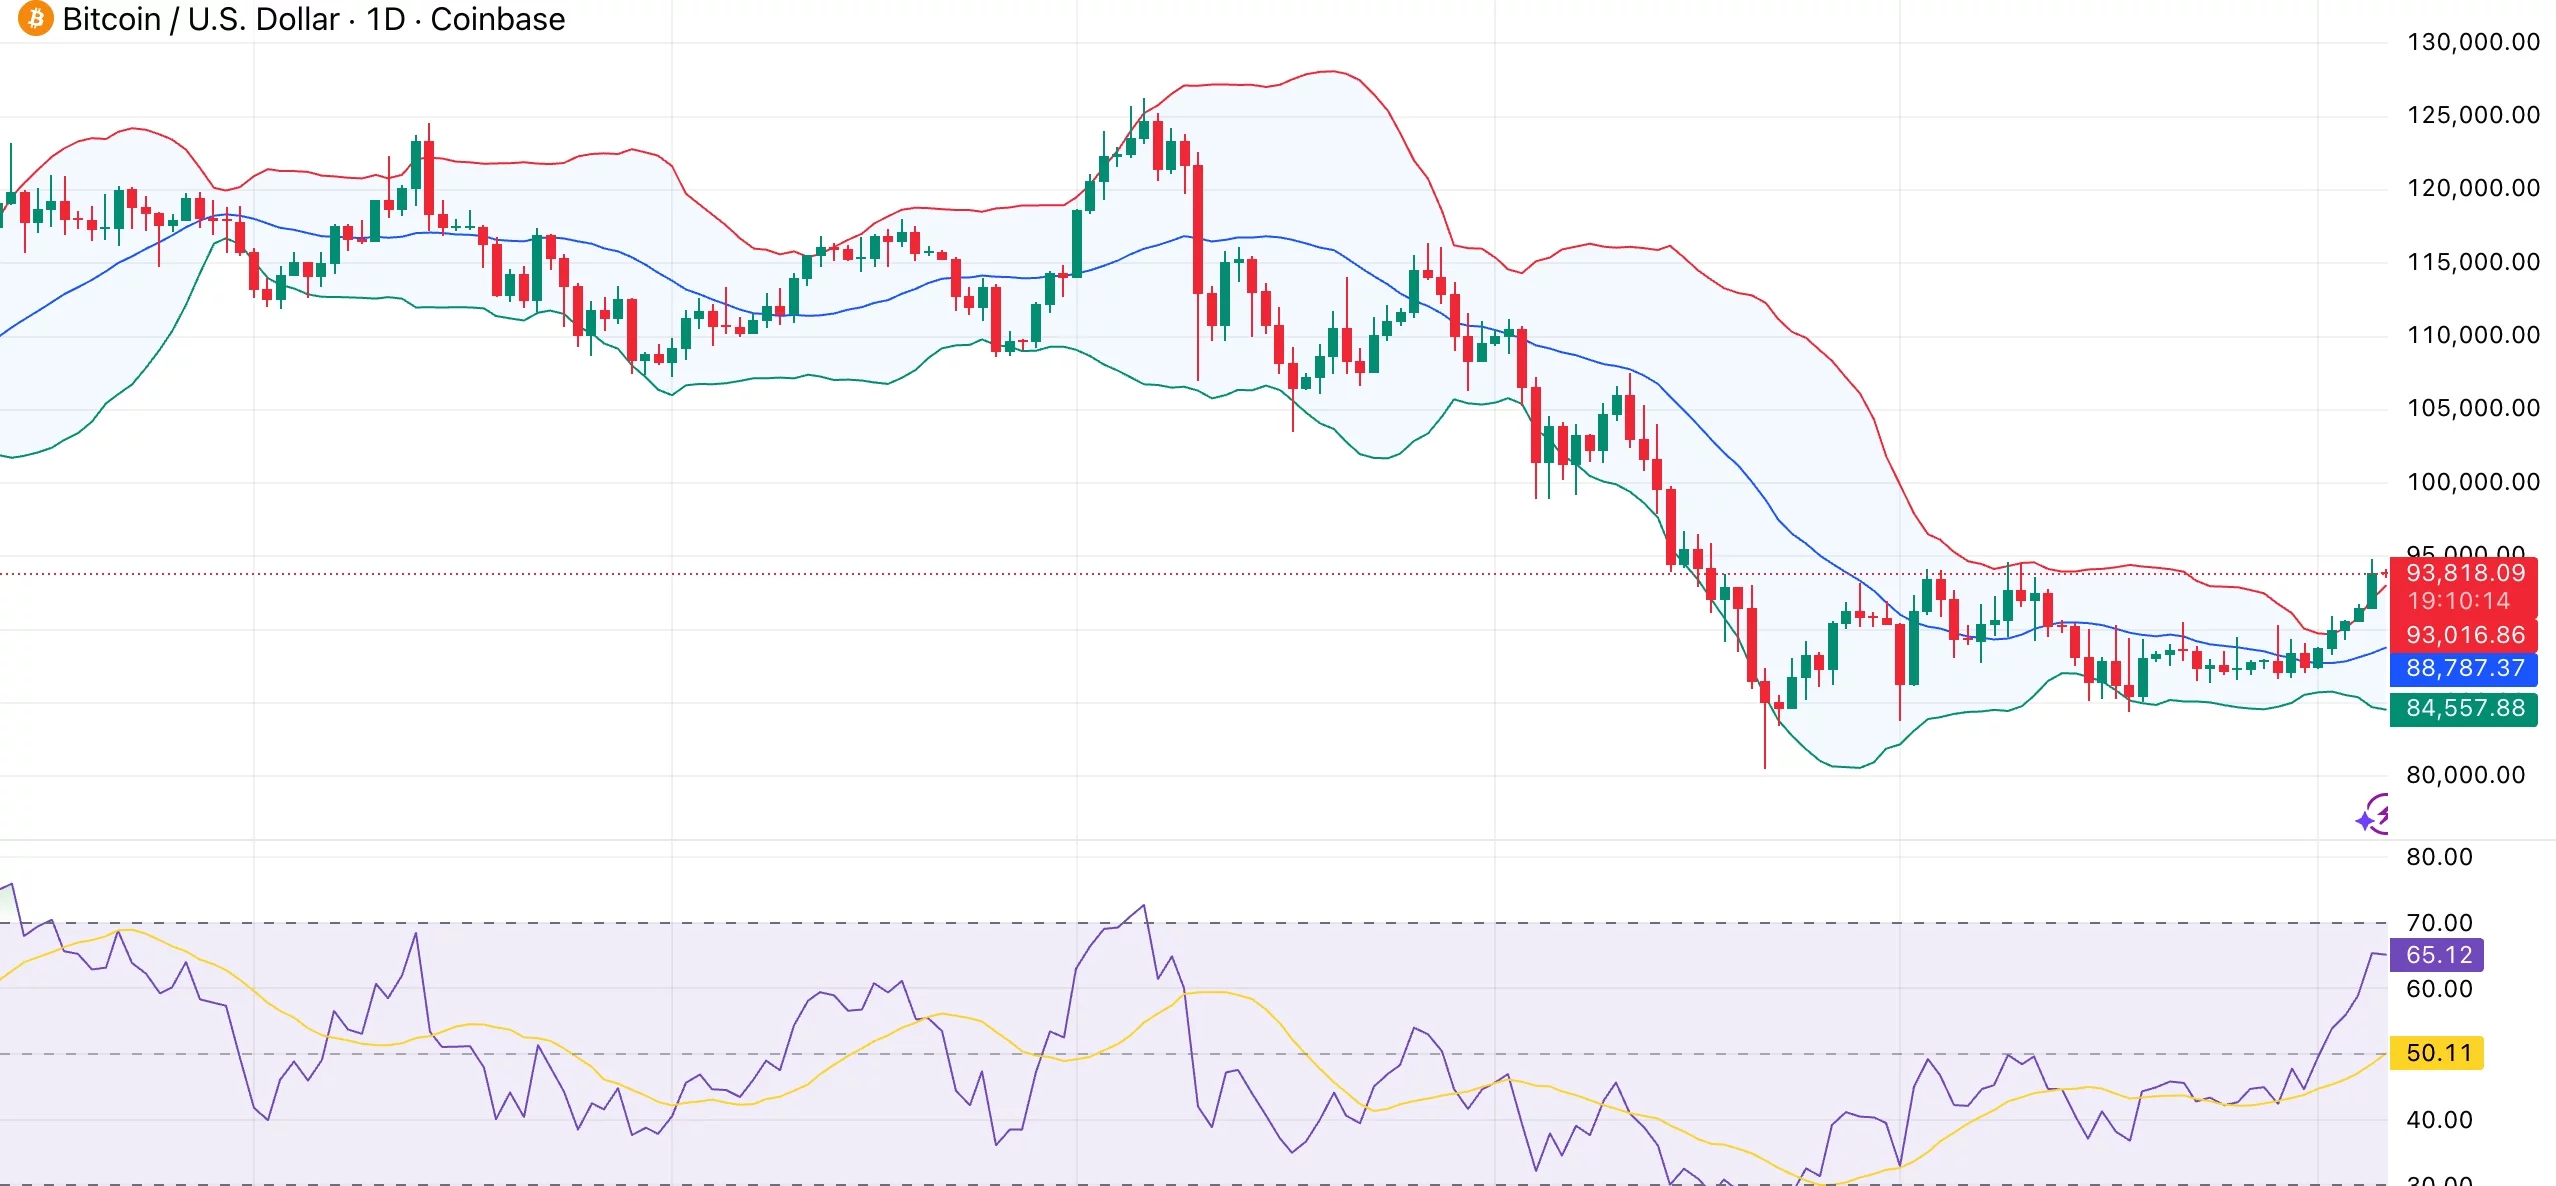
Momentum is sending mixed signals. The relative strength index at 65 indicates strengthening, but Williams %R and the stochastic RSI near 99 suggest that the move might be stretched in the near future.
Fading momentum and a CCI above 230 indicate that the rally is losing ground as it encounters resistance.
Bollinger Bands show price lifting away from the lower band after the bounce near $84,500, with BTC now trading in the upper half of the range. That behavior is consistent with mean reversion rather than a breakout phase.
If price holds above the $92,000–$93,000 area and consolidates, a clean push through $95,000 could bring the $100,000 level back into focus. A failure to maintain current levels would shift attention back toward $90,000 and the $88,500 zone, where short-term averages converge.