Bitcoin price at risk as cooling CPI data fails to offset Trump tariff concerns


Bitcoin could keep sliding as cooler-than-expected U.S. inflation data has sparked fears that President Trump might go harder on tariffs, a move that could actually bring inflation back up in the long run.
On Friday, Bitcoin (BTC) dropped below $80,000 and was still down about 1.6% over the last 24 hours at press time. This came even as the U.S. Consumer Price Index (CPI) for March showed inflation falling to 2.4%, down from 2.8% in February and slightly better than the 2.5% forecasted by analysts.
The CPI, released monthly by the U.S. Bureau of Labor Statistics, is a key inflation gauge and influences the Federal Reserve’s monetary policy decisions. Normally, lower inflation reduces the need for rate hikes, which tends to benefit risk assets like crypto and stocks.
However, despite the positive CPI reading, markets didn’t rally. The S&P 500 and Nasdaq both opened sharply lower and closed the day down 3.4% and 4.3%, respectively.
The total crypto market cap has also dropped 2.8% in the past 24 hours, suggesting that broader concerns are overshadowing any relief from cooling inflation.
Trump’s trade policies remain the key concern. On April 9, President Trump announced a 90-day pause on planned tariff hikes and introduced a 10% reciprocal tariff on most countries — but notably excluded China, where it raised tariffs on Chinese imports to a steep 125%, accusing Beijing of failing to respect global trade norms.
The move briefly calmed markets, sending Bitcoin up over 7% to $82,000 as investors welcomed the temporary easing of trade tensions.
However, that optimism quickly faded after China responded with 84% tariffs on U.S. goods starting April 10. This retaliation renewed fears of a prolonged U.S.-China trade war, which could weigh heavily on investor confidence, especially after the 90-day window ends.
According to pundits at The Kobeissi Letter, the combination of a strong jobs report and cooling inflation may actually give Trump more political room to escalate tariffs further, potentially undoing the progress made on inflation.
At the same time, the likelihood of the Federal Reserve cutting interest rates in the near term appears slim. CME Group’s FedWatch Tool points to an 81.5% chance the Fed will hold rates steady at its May 7 meeting. With no rate cuts expected until at least June, the macro backdrop remains uncertain for Bitcoin.
Capital inflows into Bitcoin have also significantly slowed this year. Analytics platform Glassnode recently flagged that inflows have plunged over 90% from a peak of $100 billion to just around $6 billion. Typically, this is a sign that investor interest may be cooling due to the current uncertainty.
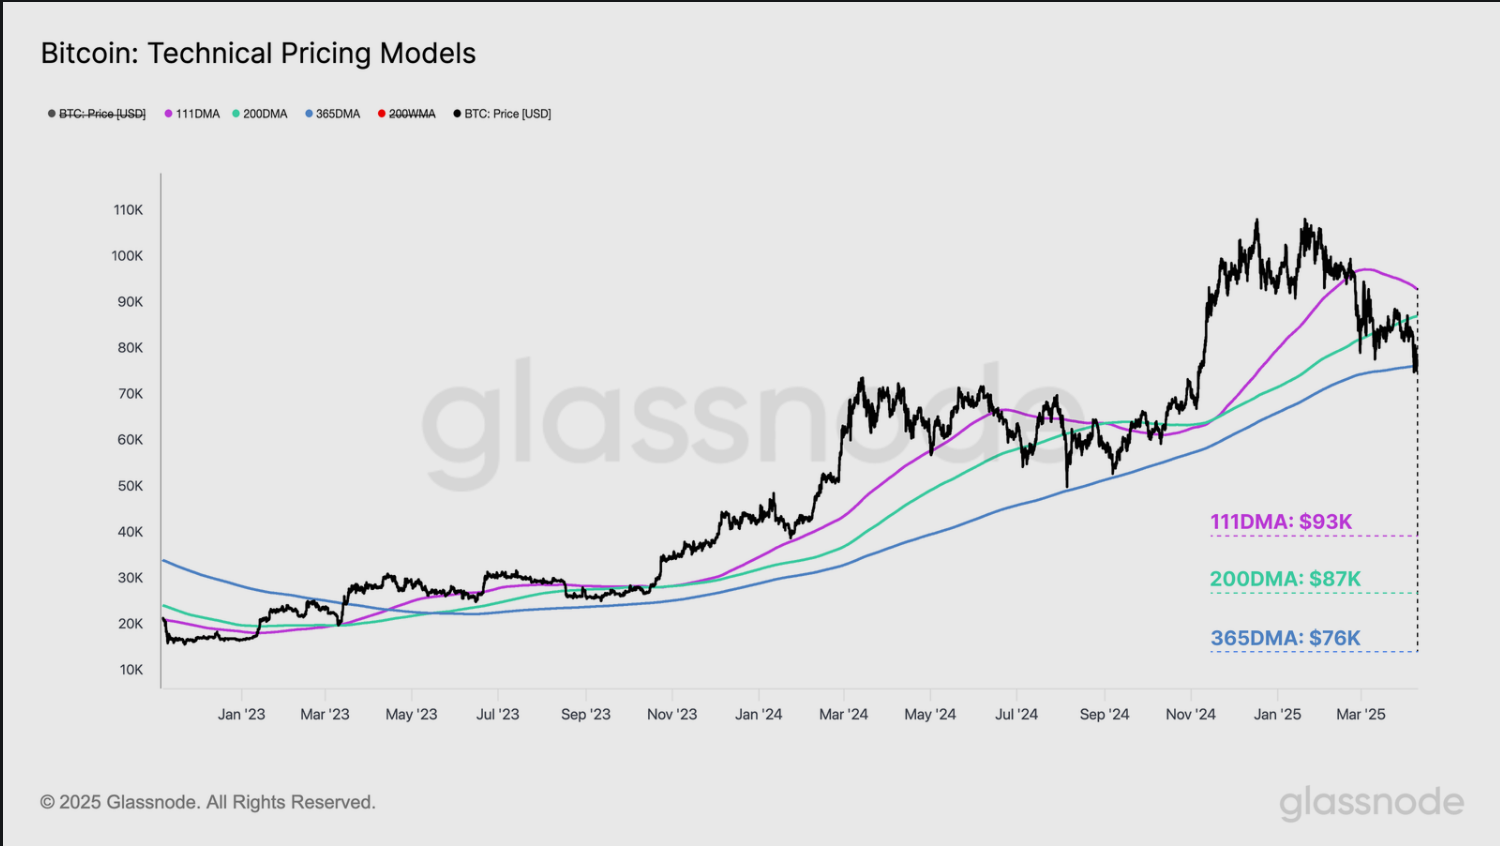
Technical indicators also point to a potential downside. If Bitcoin fails to hold the $80,000 level, Glassnode analysts warn it could revisit lower support zones, possibly the 356-day exponential moving average at $76k.
The next key levels to watch below this price point are the active realized price at $71,000, and if things worsen, the true market mean near $65,000. These are major support zones where long-term holders usually step in. But if BTC loses this range, it could mean more downside ahead.
Analysts remain hopeful
Still, not everyone views Bitcoin’s recent pullback as a sign of weakness. Some analysts argue that Bitcoin is, in fact, holding up remarkably well in comparison to traditional markets.
While Bitcoin’s seven-day realized volatility has doubled to 83%, it still remains significantly lower than the S&P 500’s, a development that hints at the asset’s potential evolution into a low-beta hedge against traditional equities. On a 30-day basis, Bitcoin appears notably less volatile than the S&P 500.
Adding to that, some on-chain data suggests that bigger players are buying the dip.
According to Santiment, 132 new “shark” wallets, those holding more than 10 BTC, have popped up in the last 24 hours.
Data from CryptoQuant also shows that around 48,575 BTC, worth roughly $3.6 billion, has moved into accumulation wallets. It’s the biggest whale activity seen since 2022, which could mean that major holders are positioning themselves for a longer-term play, even as short-term uncertainty lingers.
That said, while many are still on edge, others are starting to see signs of a potential recovery on the charts.
According to Merlijn The Trader, Bitcoin just finished a double bottom pattern, which is a classic sign of a trend reversal. Now that it’s trading above $81k and has already bounced off the $79,900 level, a potential breakout could be on the horizon with upside targets around $86K..
If BTC manages to post a weekly close above $86k, some analysts believe it could pave the way for bulls to target $94k. See below:
However, unless some form of resolution is reached between the U.S. and China, this tug-of-war over tariffs will likely keep dragging on markets.
Disclosure: This article does not represent investment advice. The content and materials featured on this page are for educational purposes only.