Bitcoin price preparing for breakout? Long-term holders add 75K BTC in 10 days


Bitcoin price is holding above $92,000 as long-term holders absorb supply and new on-chain data points to a tightening market that may be preparing for a breakout.
- Bitcoin rises toward $93K as long-term holders accumulate.
- Binance data shows a rare divergence with record withdrawals and weak deposits.
- Technicals show a tightening volatility pattern that could lead to a breakout.
Bitcoin was trading at $92,534 at press time, up 2.5% in the past 24 hours. The weekly range sits between $88,202 and $94,267, while the asset remains down 26% below its $126,080 all-time high from October.
Trading volume over the past 24 hours came in at $46 billion, down 19%, suggesting reduced activity after a volatile week. According to CoinGlass data, derivatives volume slipped 9% to $93 billion, while open interest climbed 1.9% to $59 billion, a sign that traders are adding fresh contracts even as spot activity cools.
This mix usually suggests that short-term traders are waiting for a decisive move rather than exiting the market.
Long-term wallets continue absorbing BTC supply
In a Dec. 12 post on X, CryptoQuant contributor Darkfost noted that accumulation wallets have been steadily absorbing Bitcoin (BTC) supply. Between Dec. 1 and Dec. 10, these addresses added 75,000 BTC, with a massive 40,000 BTC bought in a single day between Dec. 9 and 10.
At the moment, these wallets hold roughly 315,000 Bitcoin. With the exception of exchanges, miners, and smart contracts, all of them share certain characteristics, such as no outgoing transactions, frequent inflows, a minimum balance threshold, and activity dating back at least 7 years.
Another CryptoQuant contributor, CryptoOnchain, pointed to an unusual divergence in activity on Binance. On Dec. 3, the 30-day estimated moving average of Bitcoin withdrawals reached 3,100 transactions, the highest level since May 2018. At the same time, deposits fell to around 320 transactions, the lowest level since 2017.
This pattern indicates a supply squeeze, a situation where coins are leaving exchanges for self-custody while fewer traders are sending BTC in to sell or take profit. Historically, such setups often appear near major bullish expansions.
Bitcoin price technical analysis
After regaining the $90,000 region, Bitcoin is moving along the middle region of the Bollinger Bands. Candles continue to trade below the upper band, suggesting that although the market is making an effort to recover, it hasn’t gained full momentum yet.
The 20-day moving average is currently serving as a short-term guide for buyers.
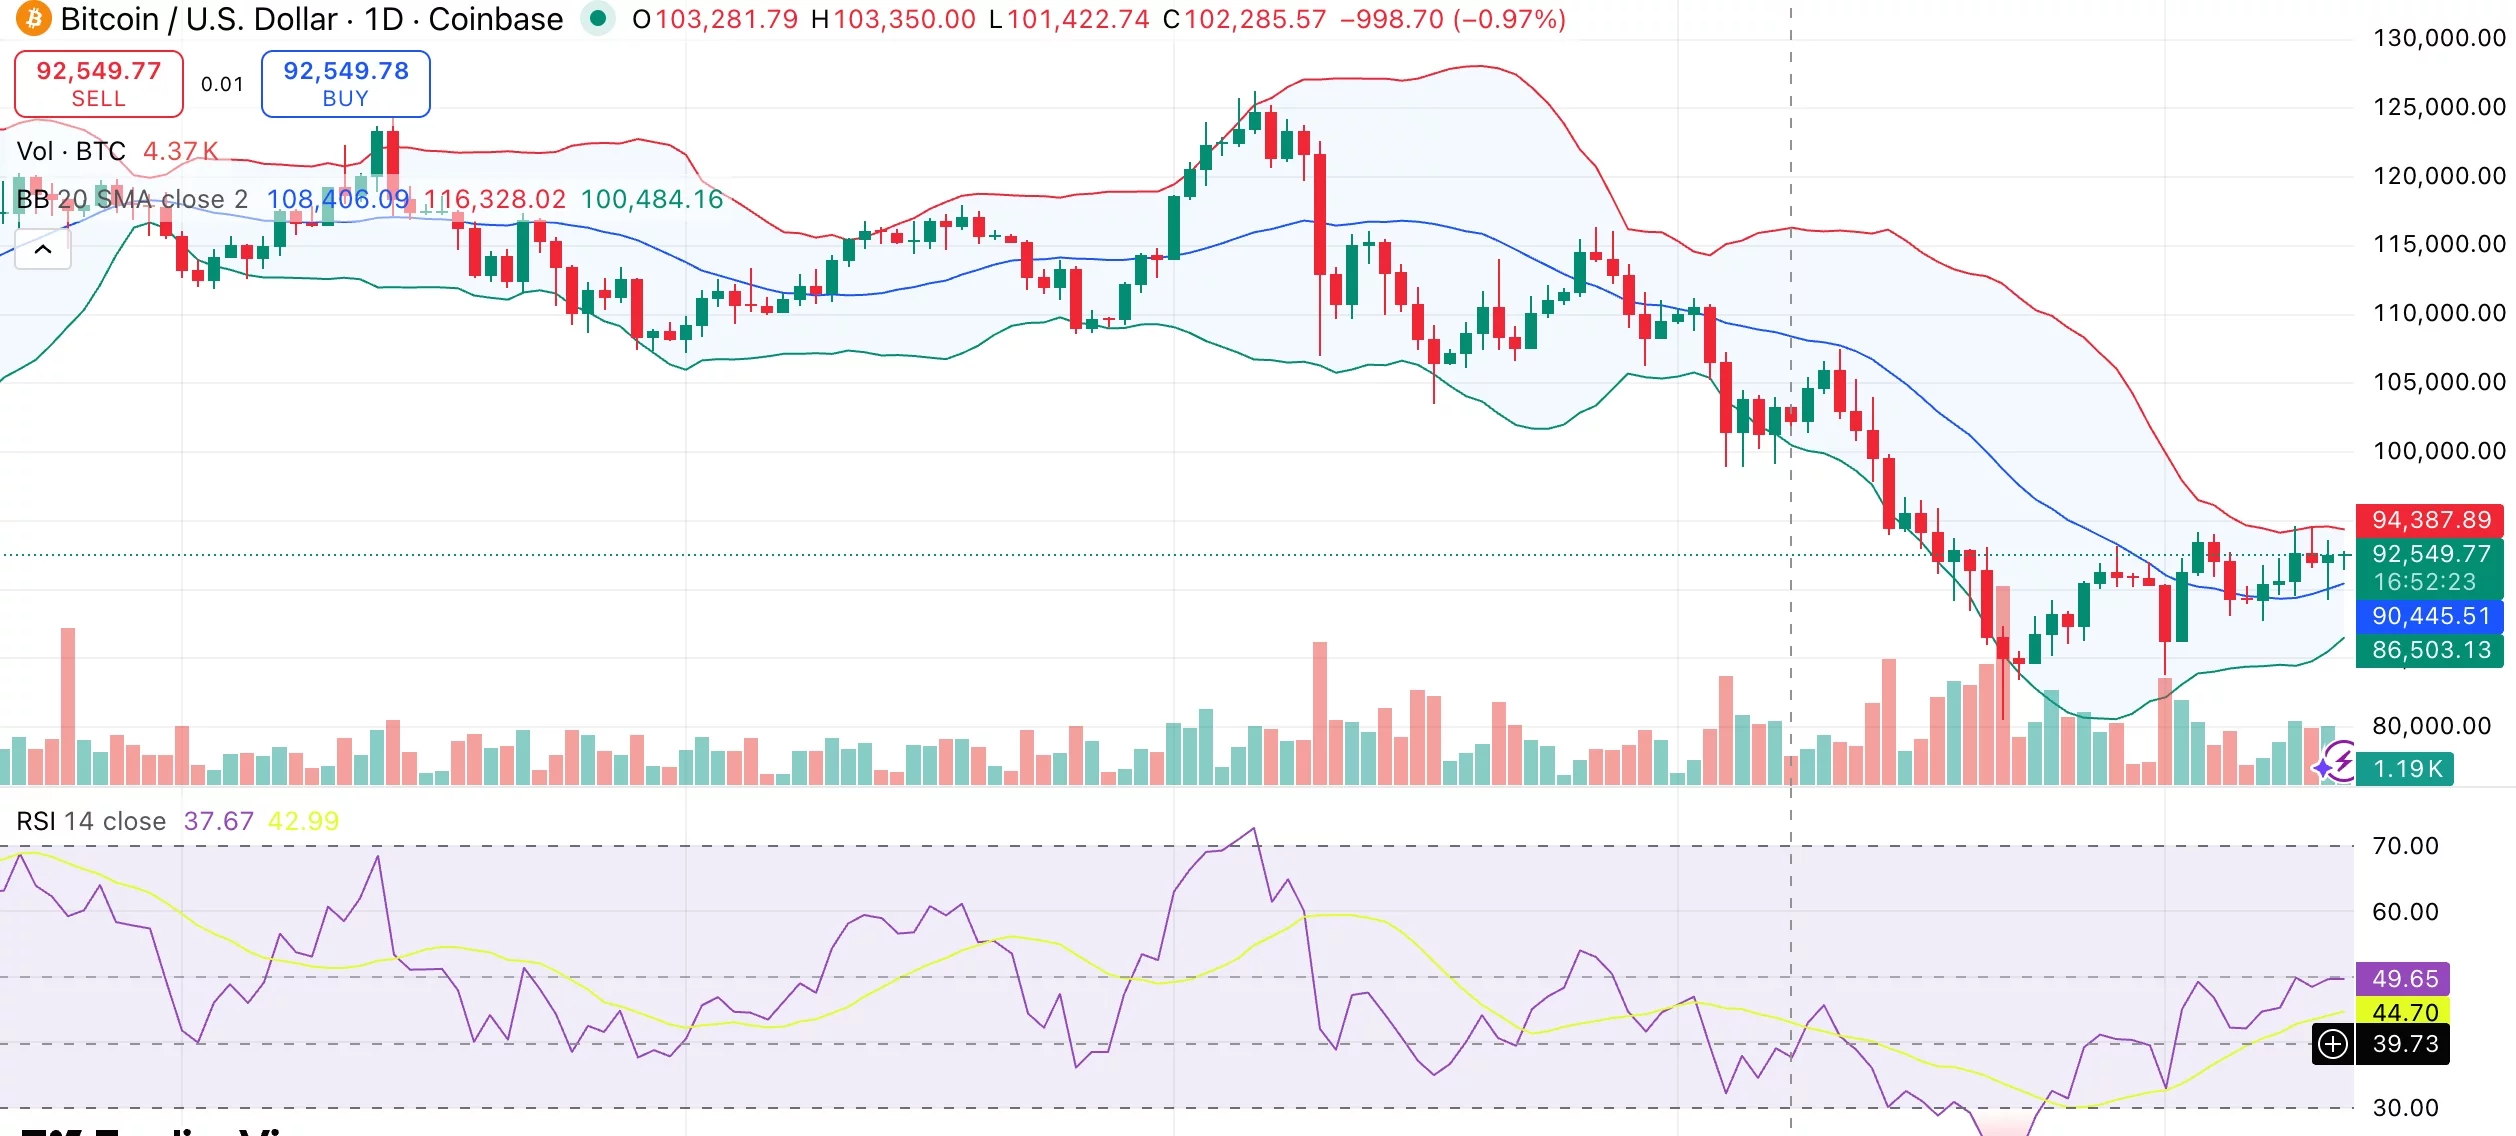
Meanwhile, the relative strength index is at 49, indicating neutral strength following a recovery from late November’s oversold levels. Furthermore, stochastic readings around 78 show indecision rather than exhaustion.
On the moving averages, Bitcoin trades above the 10-day and 20-day MAs, while the 50-day, 100-day, and 200-day remain above the current price, showing that the broader trend is still recovering.
A close above $94,500 could open the door to $100,000, especially if on-chain withdrawal strength continues. Breaking the upper Bollinger Band would give buyers a clean signal. Failure to hold $90,000–$91,000 may lead to a drop toward $86,500, where the lower band and key liquidity zone meet.