Bitcoin price charts point to explosive gains in the long term


Bitcoin and other cryptocurrencies started the week well, buoyed by ongoing stimulus discussions in China, the world’s second-largest economy.
Bitcoin (BTC) crossed the important resistance point of $65,000 for the first time since Sept. 30. It has risen by over 10% from its lowest level this month and by 32% from its August low, signaling that it is in a bull market.
Bitcoin’s surge coincided with a strong rally in the global equity market after Chinese officials unveiled a series of stimulus measures.
The Shanghai Composite Index rose by 2%, while the Shenzhen index increased by 2.65%. A similar trend occurred in other Asian and European markets. In the U.S., futures tied to the Nasdaq 100 and Dow Jones continued to rise.
Bitcoin’s rally also followed increased institutional interest, with investors continuing to buy spot Bitcoin ETFs. Data from SoSoValue that ETFs saw net inflows of $308 million last week.
BTC monthly chart points to more gains
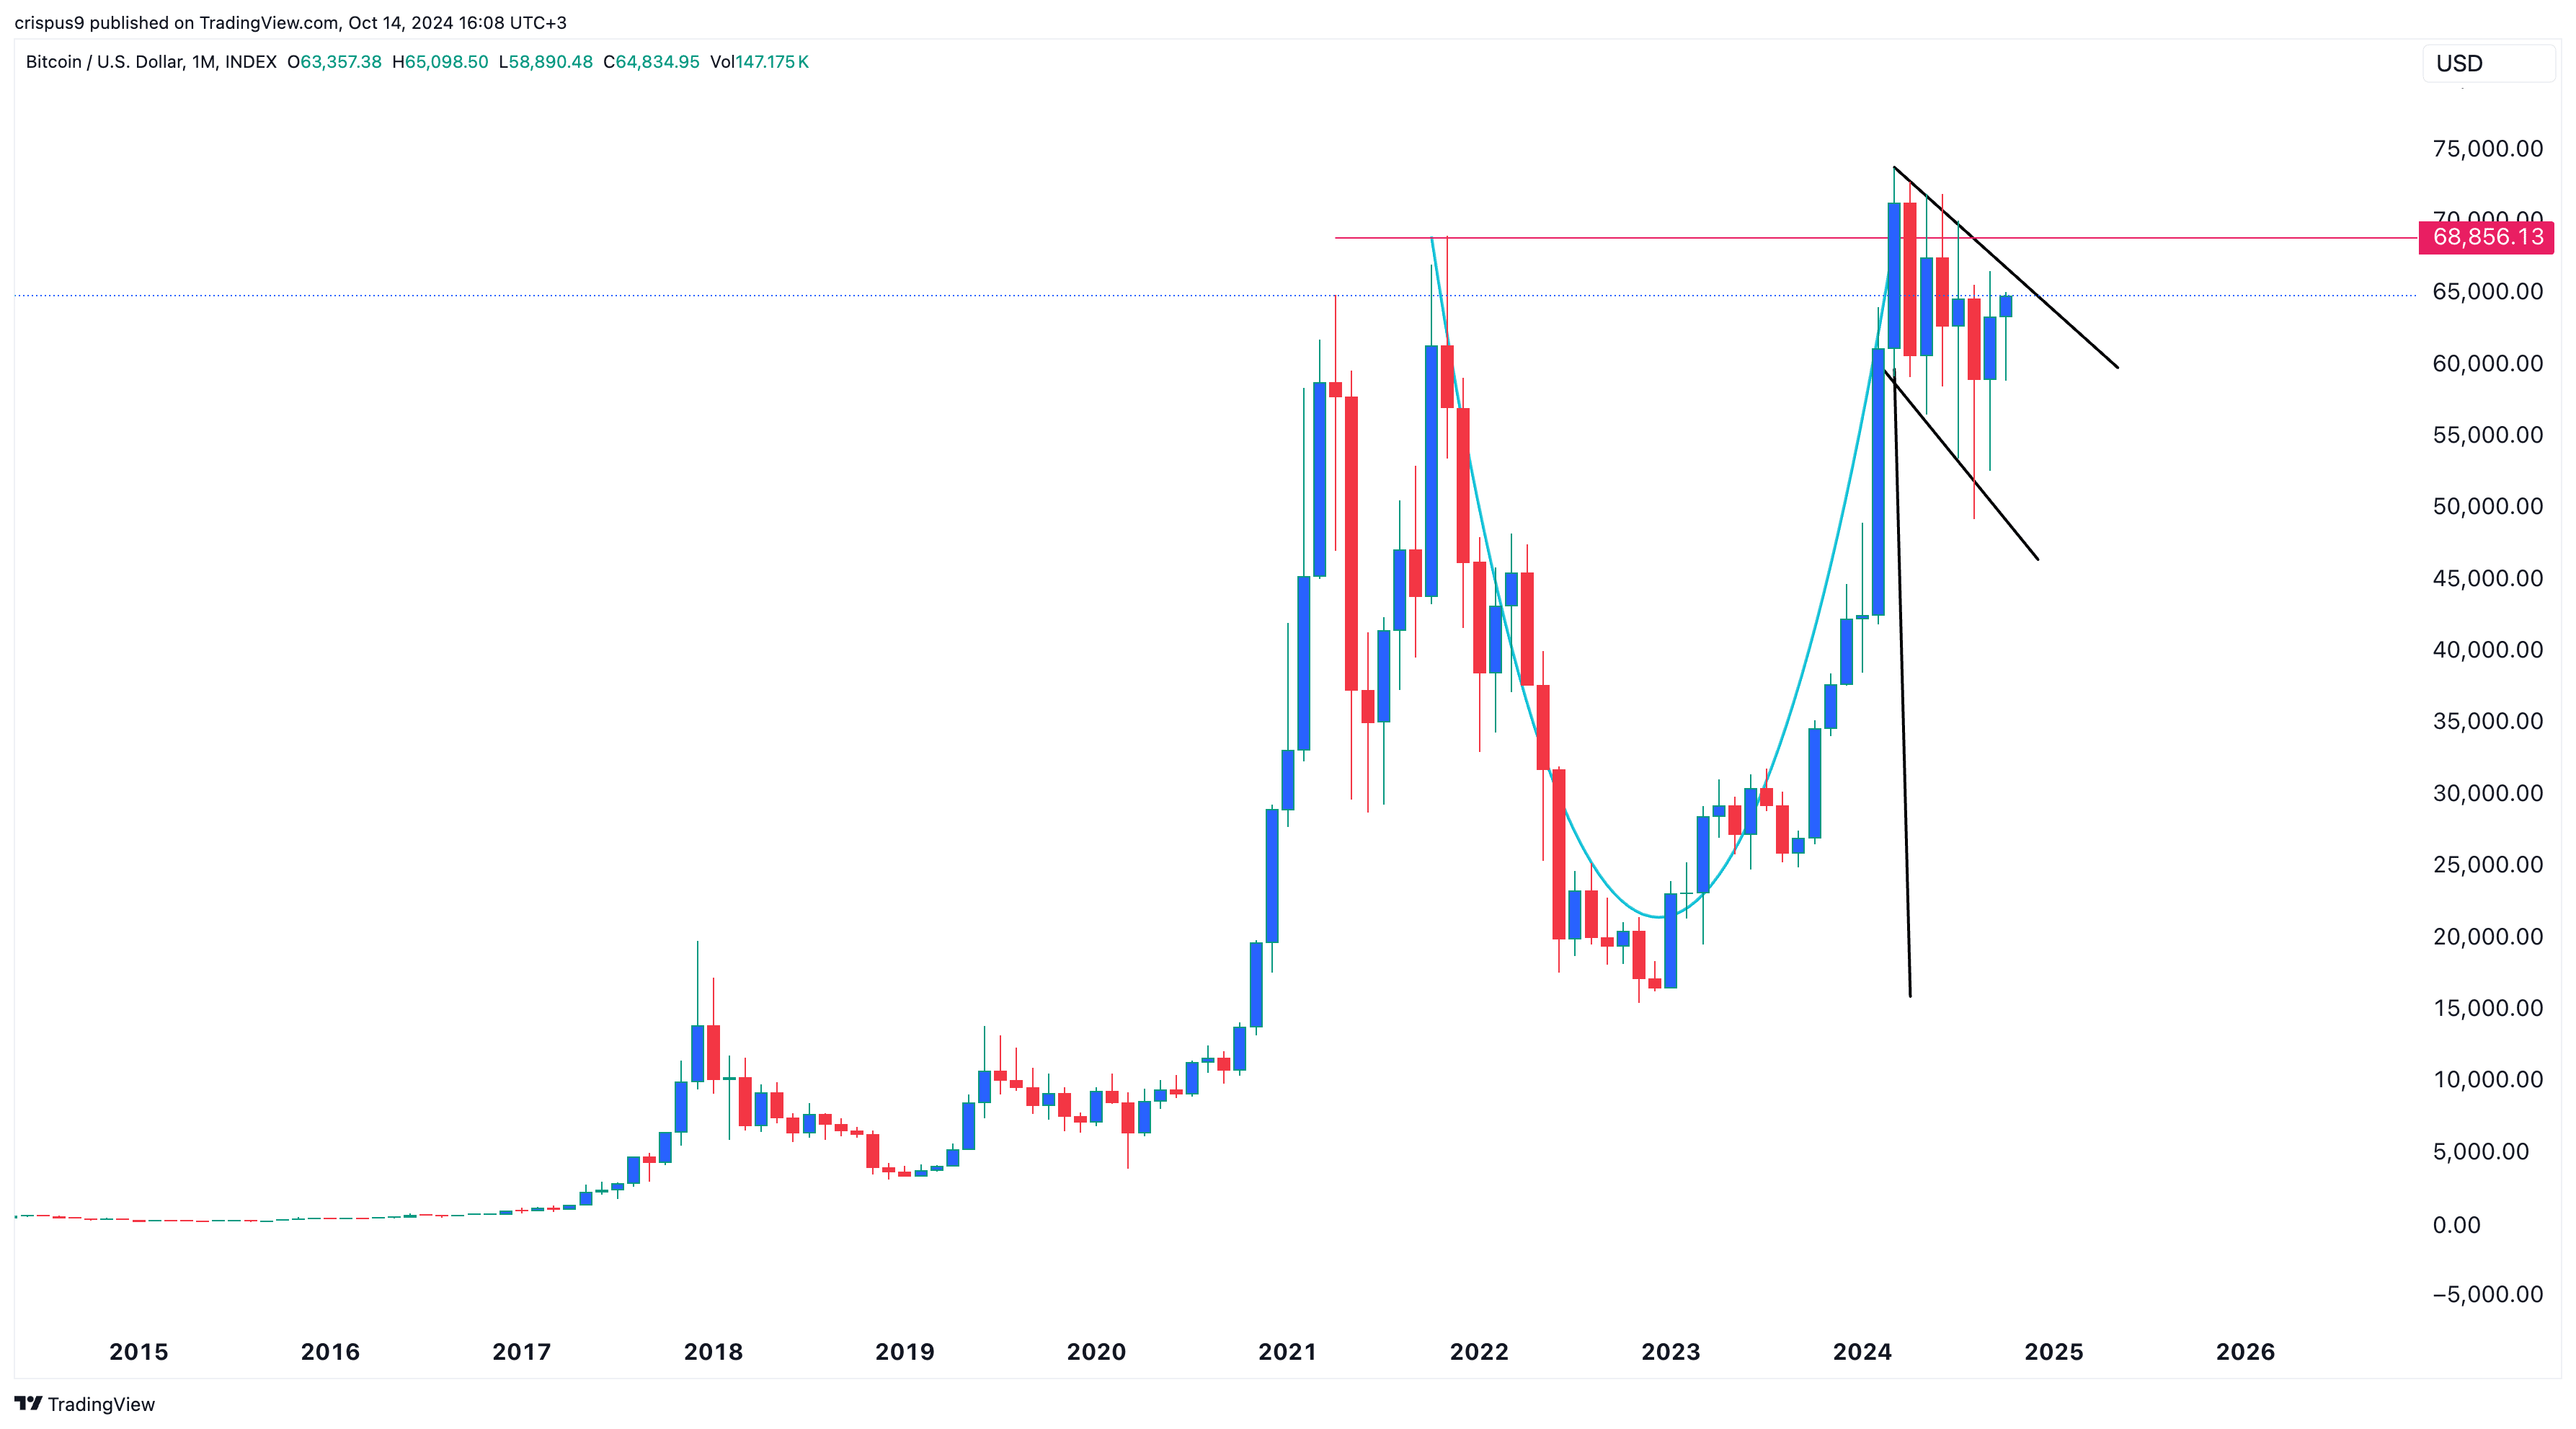
The monthly chart suggests that Bitcoin may experience more long-term gains. It shows that the BTC price has been forming a cup-and-handle pattern since peaking at $68,856 in 2021. It retested that level again this year and formed a rounded bottom.
The recent consolidation has been part of the handle section, which typically precedes a major bullish breakout.
This consolidation is also part of a bullish flag pattern, characterized by a long flagpole followed by rectangular consolidation.
Additionally, the chart shows that Bitcoin formed a hammer candlestick pattern in August. This pattern, characterized by a long lower shadow and a large body, is one of the most bullish signs.
Therefore, more gains will be confirmed if Bitcoin rises above the year-to-date high of $73,800. However, these patterns, especially on the monthly chart, can take time to fully play out.
Bitcoin daily chart catalysts
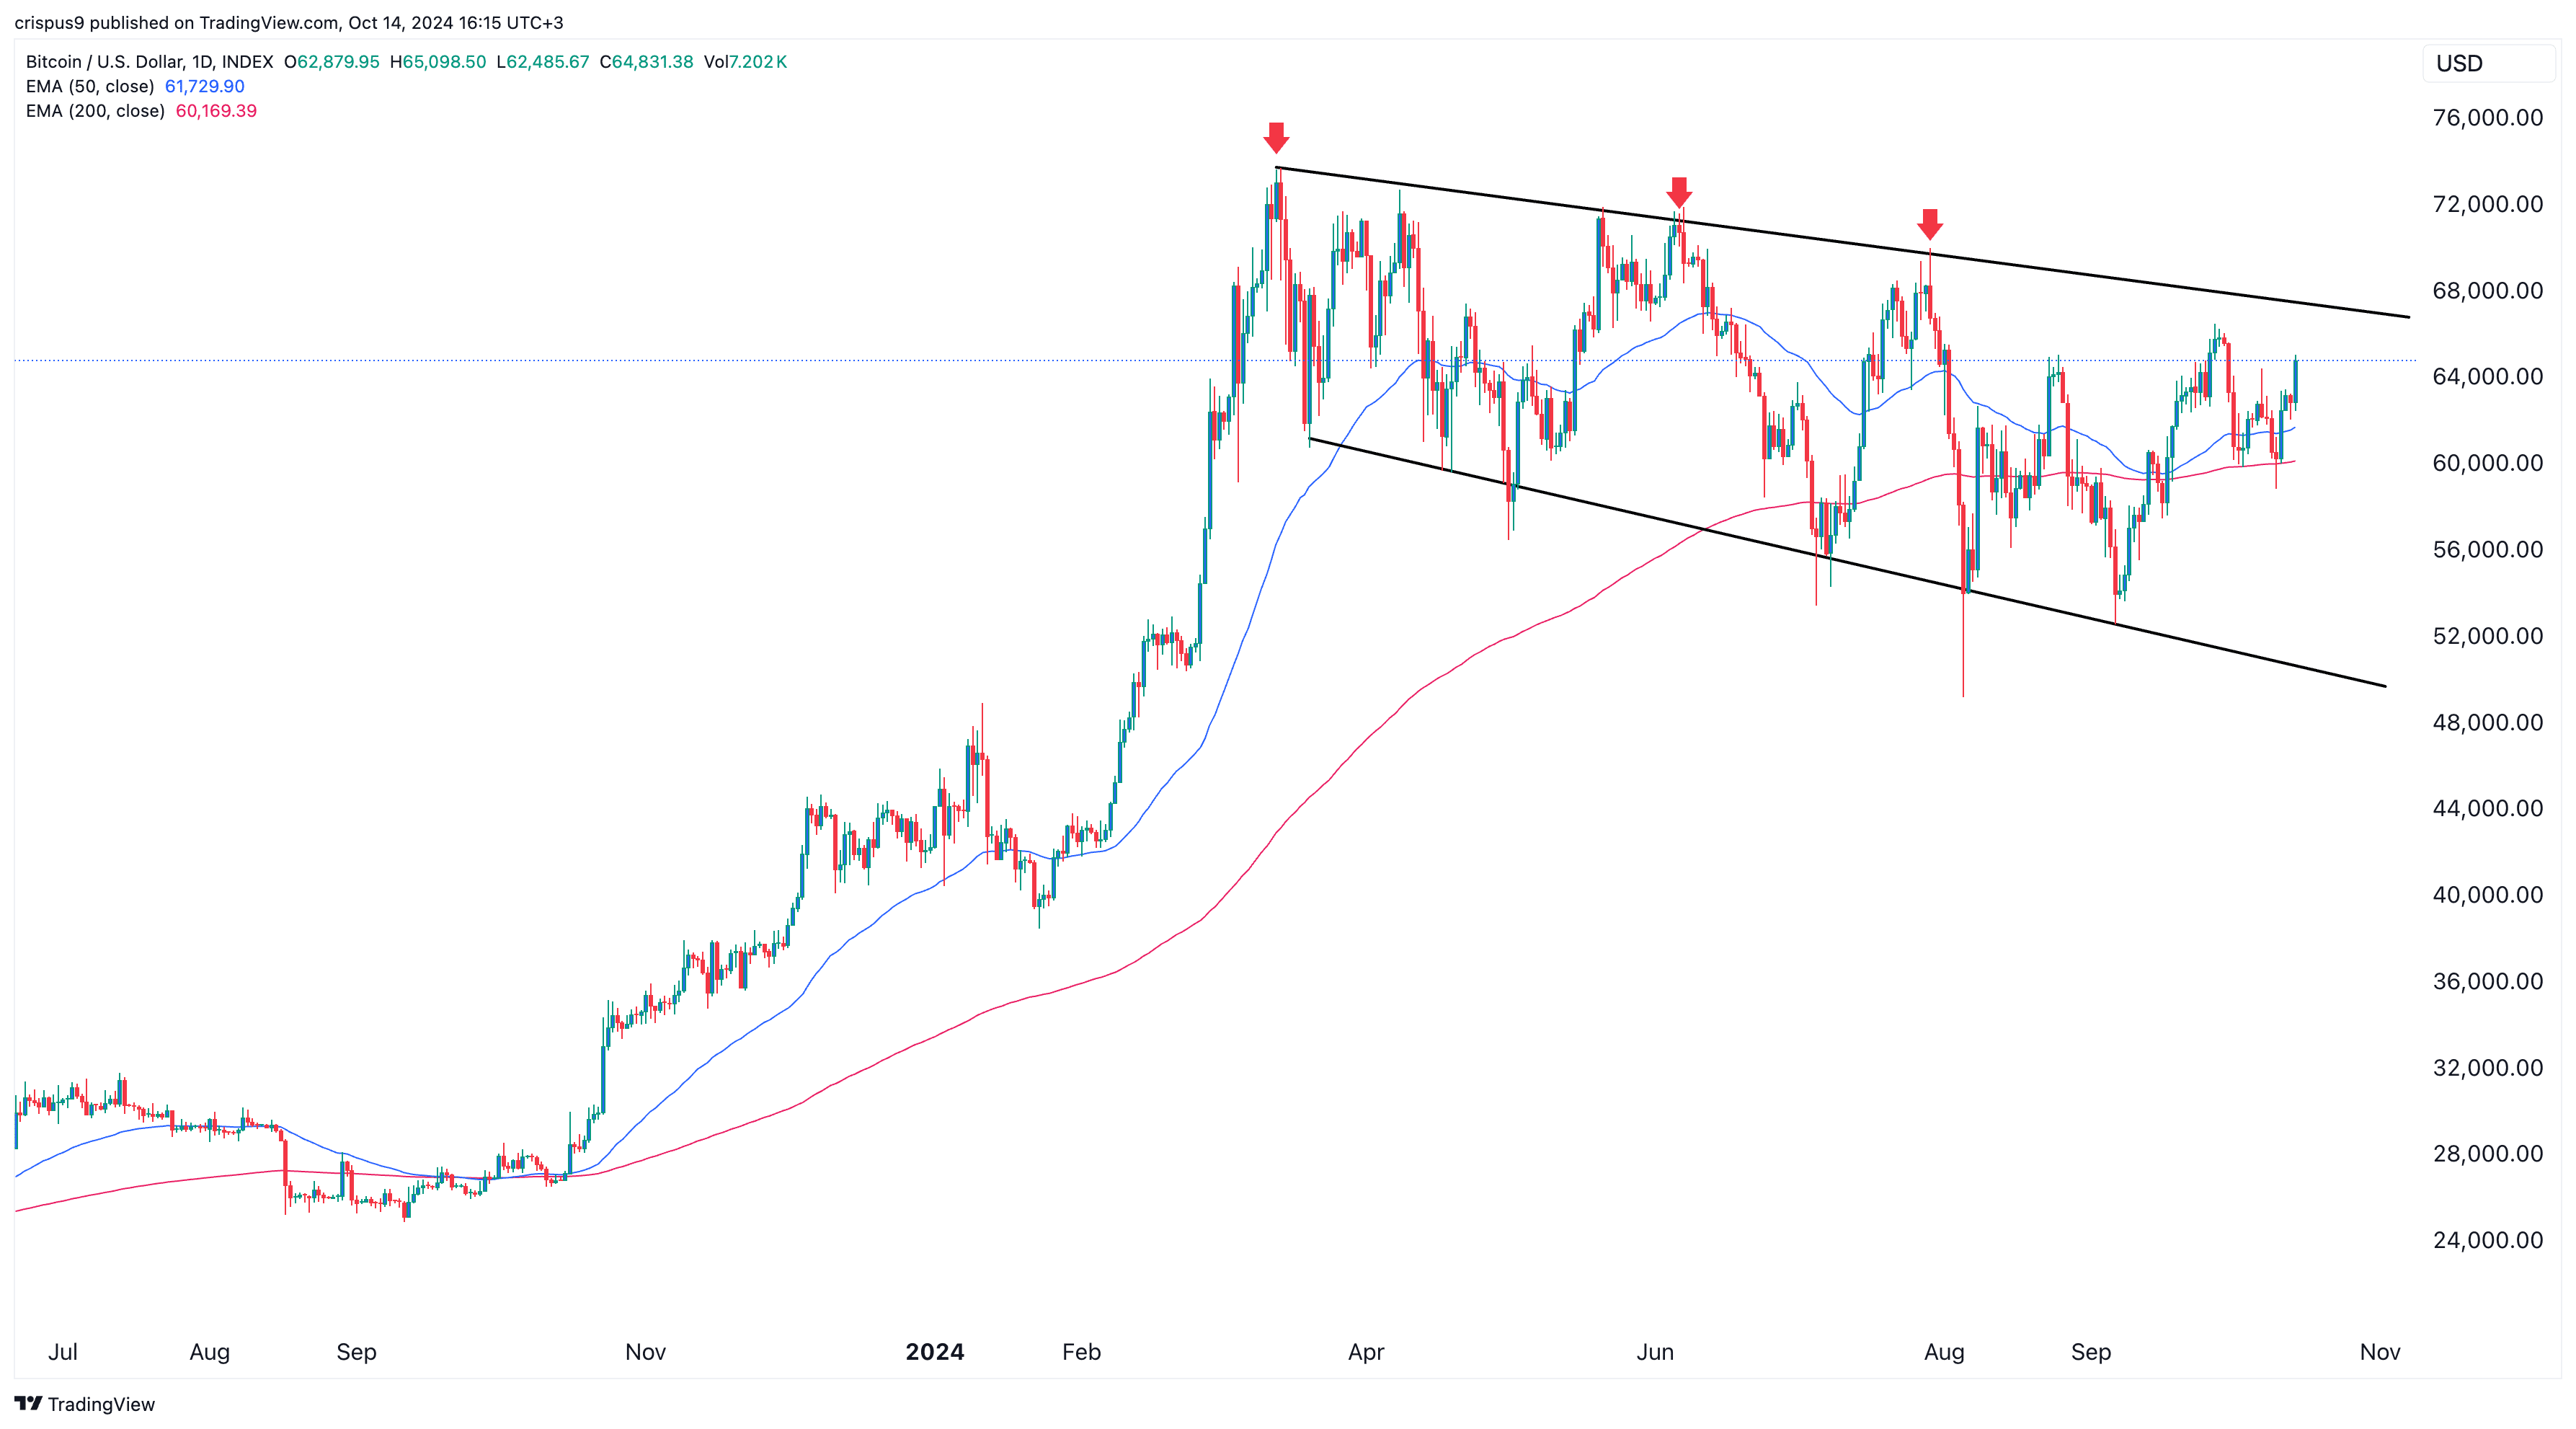
The daily chart also indicates potential near-term gains. Bitcoin has remained solidly above the 50-day and 200-day Exponential Moving Averages. It has also avoided forming a death cross pattern, which often signals further downside.
Bitcoin has also been forming a broadening wedge pattern since March, characterized by a series of higher lows and lower highs. In this case, its higher lows were at $73,800, $72,000, and $70,000.
A break above the descending trendline and the all-time high at $73,800 will confirm a bullish breakout and likely lead to further gains. The odds of Bitcoin reaching a record high this year are increasing.
According to Polymarket, there is a 62% chance that Bitcoin will rise to $63,800 this year, the highest odds since Sept. 29 and significantly higher than this month’s low of 32%.