Bitcoin price flirts with $120k correction as market cools, can the rally resume?


The latest Bitcoin price rally appears to be losing momentum after a record-breaking run, with prices now testing key levels that could decide its next move.
- Bitcoin price trades near $122,000 after briefly dipping toward $120,600, marking a mild cooldown following its surge to new all-time highs.
- The multi-day rally from early October’s “Uptober” run saw BTC break $126,000 before consolidating in a tight range on lower volumes.
- A double bottom pattern and low profit-taking activity suggest bullish momentum may continue if Bitcoin holds above $120,000 support.
Bitcoin price is trading around $122,000 at the time of writing, reflecting a modest pullback that leaves it up 0.46% on the day as momentum cools after its recent surge to new highs. The crypto king’s price slipped near $120,600 earlier in the day, and remains in a tight range just above yesterday’s levels.
The current price action reflects a broader slowdown across the crypto market as the recent rally shows signs of losing steam. Over the past seven days, Bitcoin (BTC) climbed from around $119,000, broke through key resistance, and topped $126,000 before settling back below $123,000.
This multi-day rally was fueled by elevated spot buying and record ETF inflows, pushing the asset to fresh all-time highs amid strong retail and institutional interest. The move, however, lost steam midweek, and the price is now consolidating between $121,000 and $125,000 amid lower volumes.
With the asset now cooling, all eyes are on whether $120,000 can hold as support for the next leg higher.
Can Bitcoin price resume rally?
Bitcoin’s technical outlook points toward further strength following the formation of a textbook double bottom pattern on the daily chart.
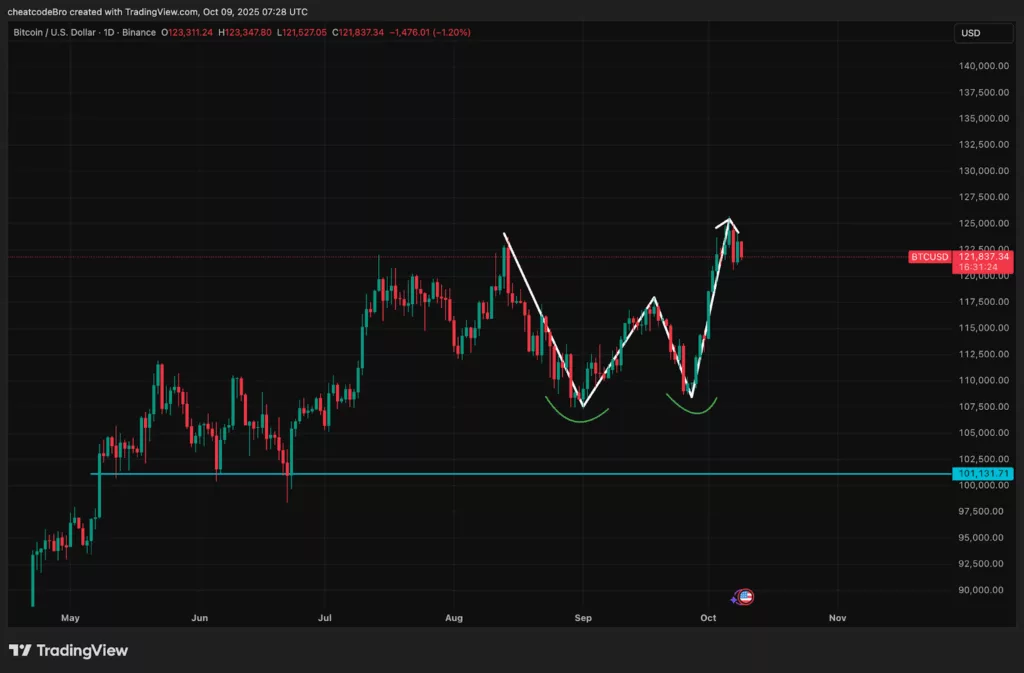
The pattern, which is marked by two significant lows at roughly the same price level and a sharp rally to new highs, is widely viewed by traders as a bullish reversal signal. In this case, Bitcoin rebounded from support near $108,000, pushed higher through the “neckline” of the pattern, and went on to notch the latest ATH.
Supporting the positive outlook, a recent CryptoQuant analysis points out that profit-taking remains relatively low even after Bitcoin’s run to its new peak, suggesting that further upside may be ahead. This subdued selling activity indicates that most holders are not rushing to offload their coins, which historically strengthens the case for sustained rallies.
If BTC holds strongly above $120,000, higher targets around the $127,000 to $137,000 zone come into play following the double bottom pattern measurements. With both the chart structure and on-chain signals favoring bulls, the potential for the asset to extend its rally remains strong.