Bitcoin price forecast: BTC forming a bullish pattern


Bitcoin price came under intense pressure this week as concerns about demand and ETF inflows continued. BTC is on track for the second consecutive week in the red, moving below key support level of $65,0000.
Bitcoin is now down more than 12% from its all-time high and it may seem like the bears are in complete control. Most spot Bitcoin ETFs have continued to see outflows after the coin failed to cross the resistance point at $72,000 last week. Data shows that all ETFs recorded net outflows of $145.9 million, led by the Fidelity Wise Origin Bitcoin Fund (FBTC).
These outflows accelerated after the Federal Reserve delivered a hawkish interest rates decision. In it, the bank left interest rates unchanged between 5.25% and 5.50% and hinted to one cut later this year.
Bitcoin price has also slipped after data showed that most Bitcoin mining companies were selling their coins. Data shows that miners, including major players like Marathon Digital and Riot Platforms, have been selling their holdings for 33 days straight.
Bitcoin price prediction
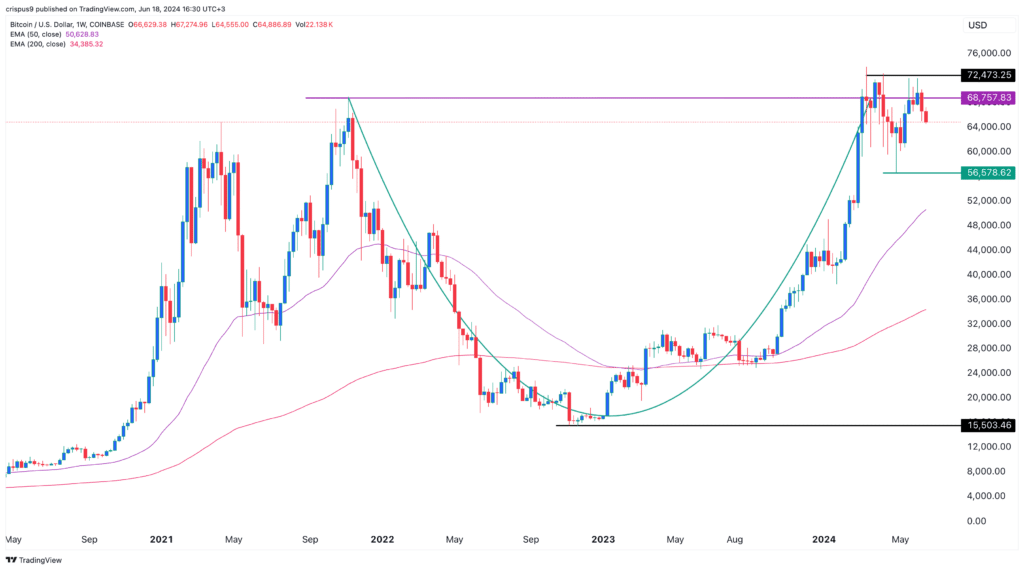
BTC weekly chart
Bitcoin formed a golden cross pattern in March 2023 as the 200-week and 50-week Exponential Moving Averages (EMA) made a bullish crossover. It has remained above these averages since then. Most important, Bitcoin is forming a cup and handle pattern, a popular bullish continuation sign. The recent consolidation is likely part of the shoulders section.
Therefore, there is a likelihood that Bitcoin will ultimately have a bullish breakout in the near-term. Such a breakout will be confirmed when the price rises above the year-to-date high of $73,500.
The main risk to the bullish thesis is that Bitcoin has formed a small double-top pattern at $72,473. A double-top is one of the most bearish signs in the market. As such, there is a possibility that it could drop and retest its neckline at $56,578, which is 12.65% below the current level.