Bitcoin price is still in a bullish trend, long-term chart shows


Bitcoin price has dropped into a bear market this year after falling by 23% from its highest point in January.
Bitcoin (BTC) was trading at $84,555 on Good Friday, up by 13% from its lowest point this year, giving it a valuation of over $1.68 trillion. It has dropped by 10% this year, outperforming the Nasdaq 100 index, which has fallen by 13%.
Historical data suggests that Bitcoin remains in a bullish trend despite the 23% dip. Moreover, the coin has experienced bigger drops in the past. For example, it fell by 35% from its peak in March last year to its lowest point in August, before bouncing back.
Bitcoin has seen deeper dives several times before. It dropped from $68,980 in November 2021 to its lowest level in 2022 as the Federal Reserve raised interest rates and several prominent crypto companies like Celsius, Terra, and FTX collapsed.
Therefore, while the ongoing pullback may continue, there are odds that it will bounce back, since its fundamentals remain strong. Bitcoin mining difficulty has reached a record high, resulting in a decrease in the number of new coins brought online.
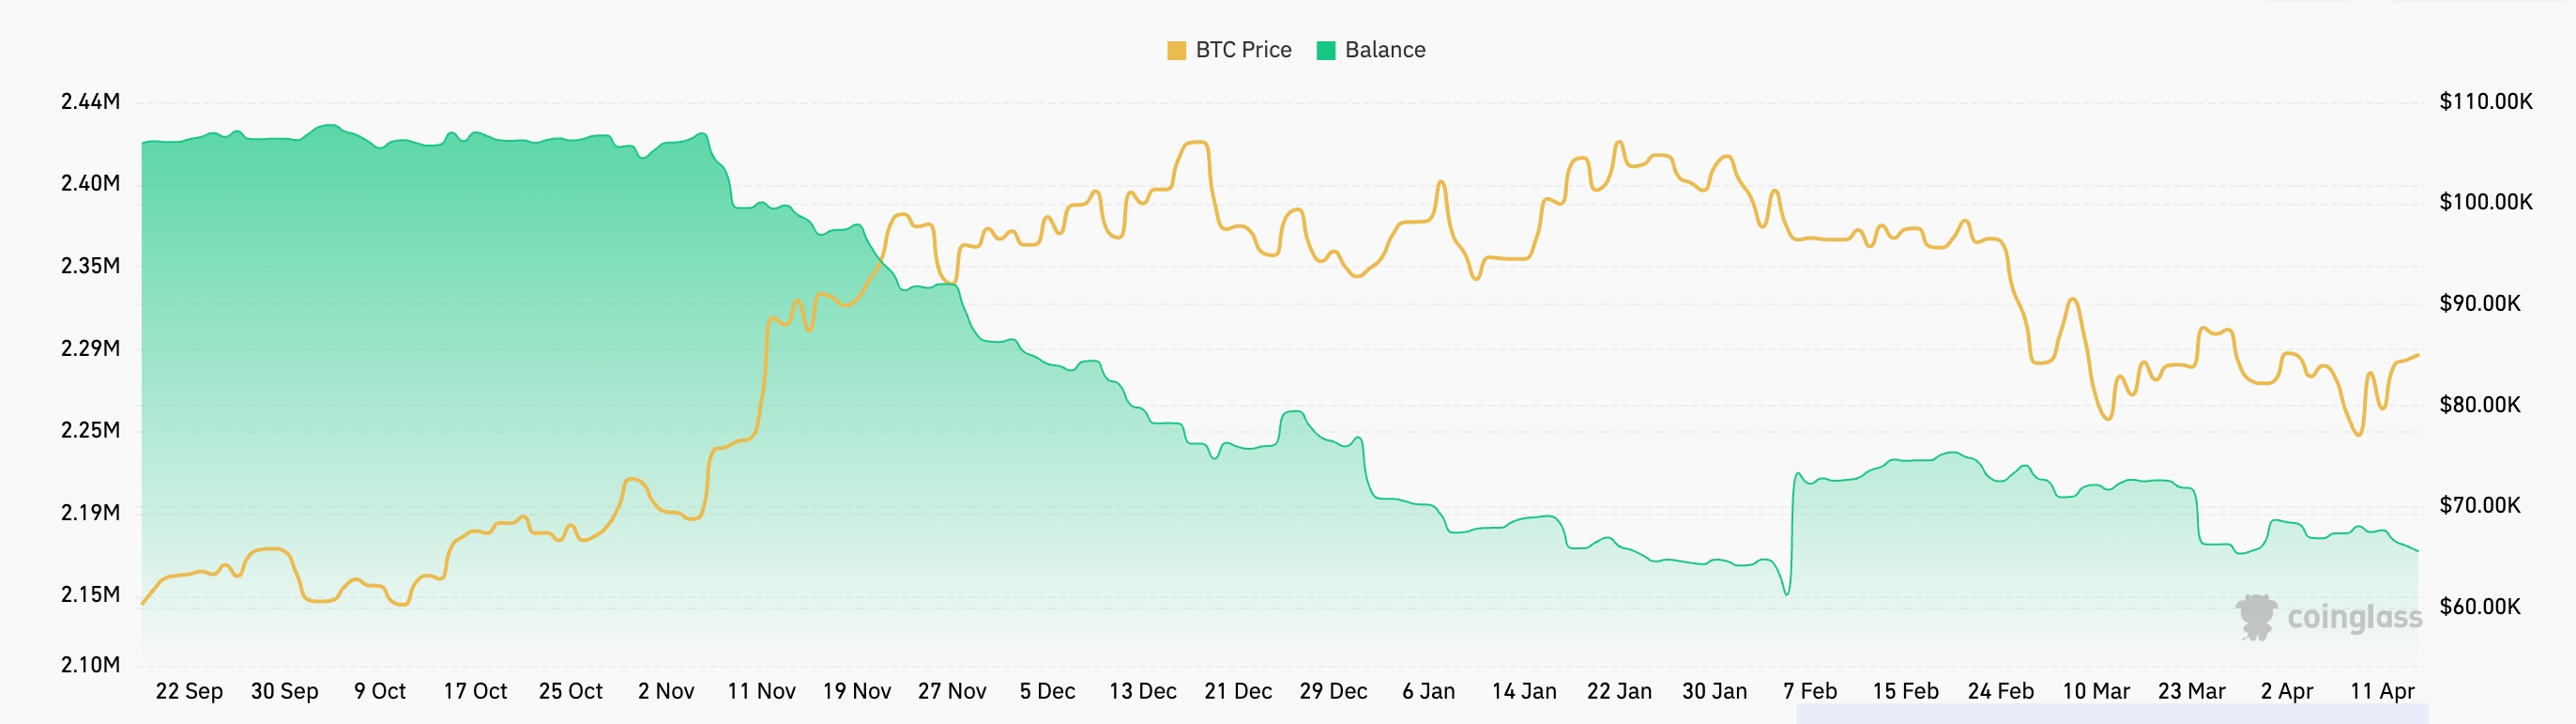
Additionally, data indicates that the number of Bitcoins on exchanges has continued to decline, suggesting that many holders are not selling. There are 2.18 million coins on exchanges, down from 2.44 million in September last year.
Another possible signal for Bitcoin is the recent gold surge. Gold has soared by over 25% this year to reach its all-time high. According to one crypto analyst, Bitcoin usually follows gold with a 100- to 150-day lag.
Bitcoin price technical analysis
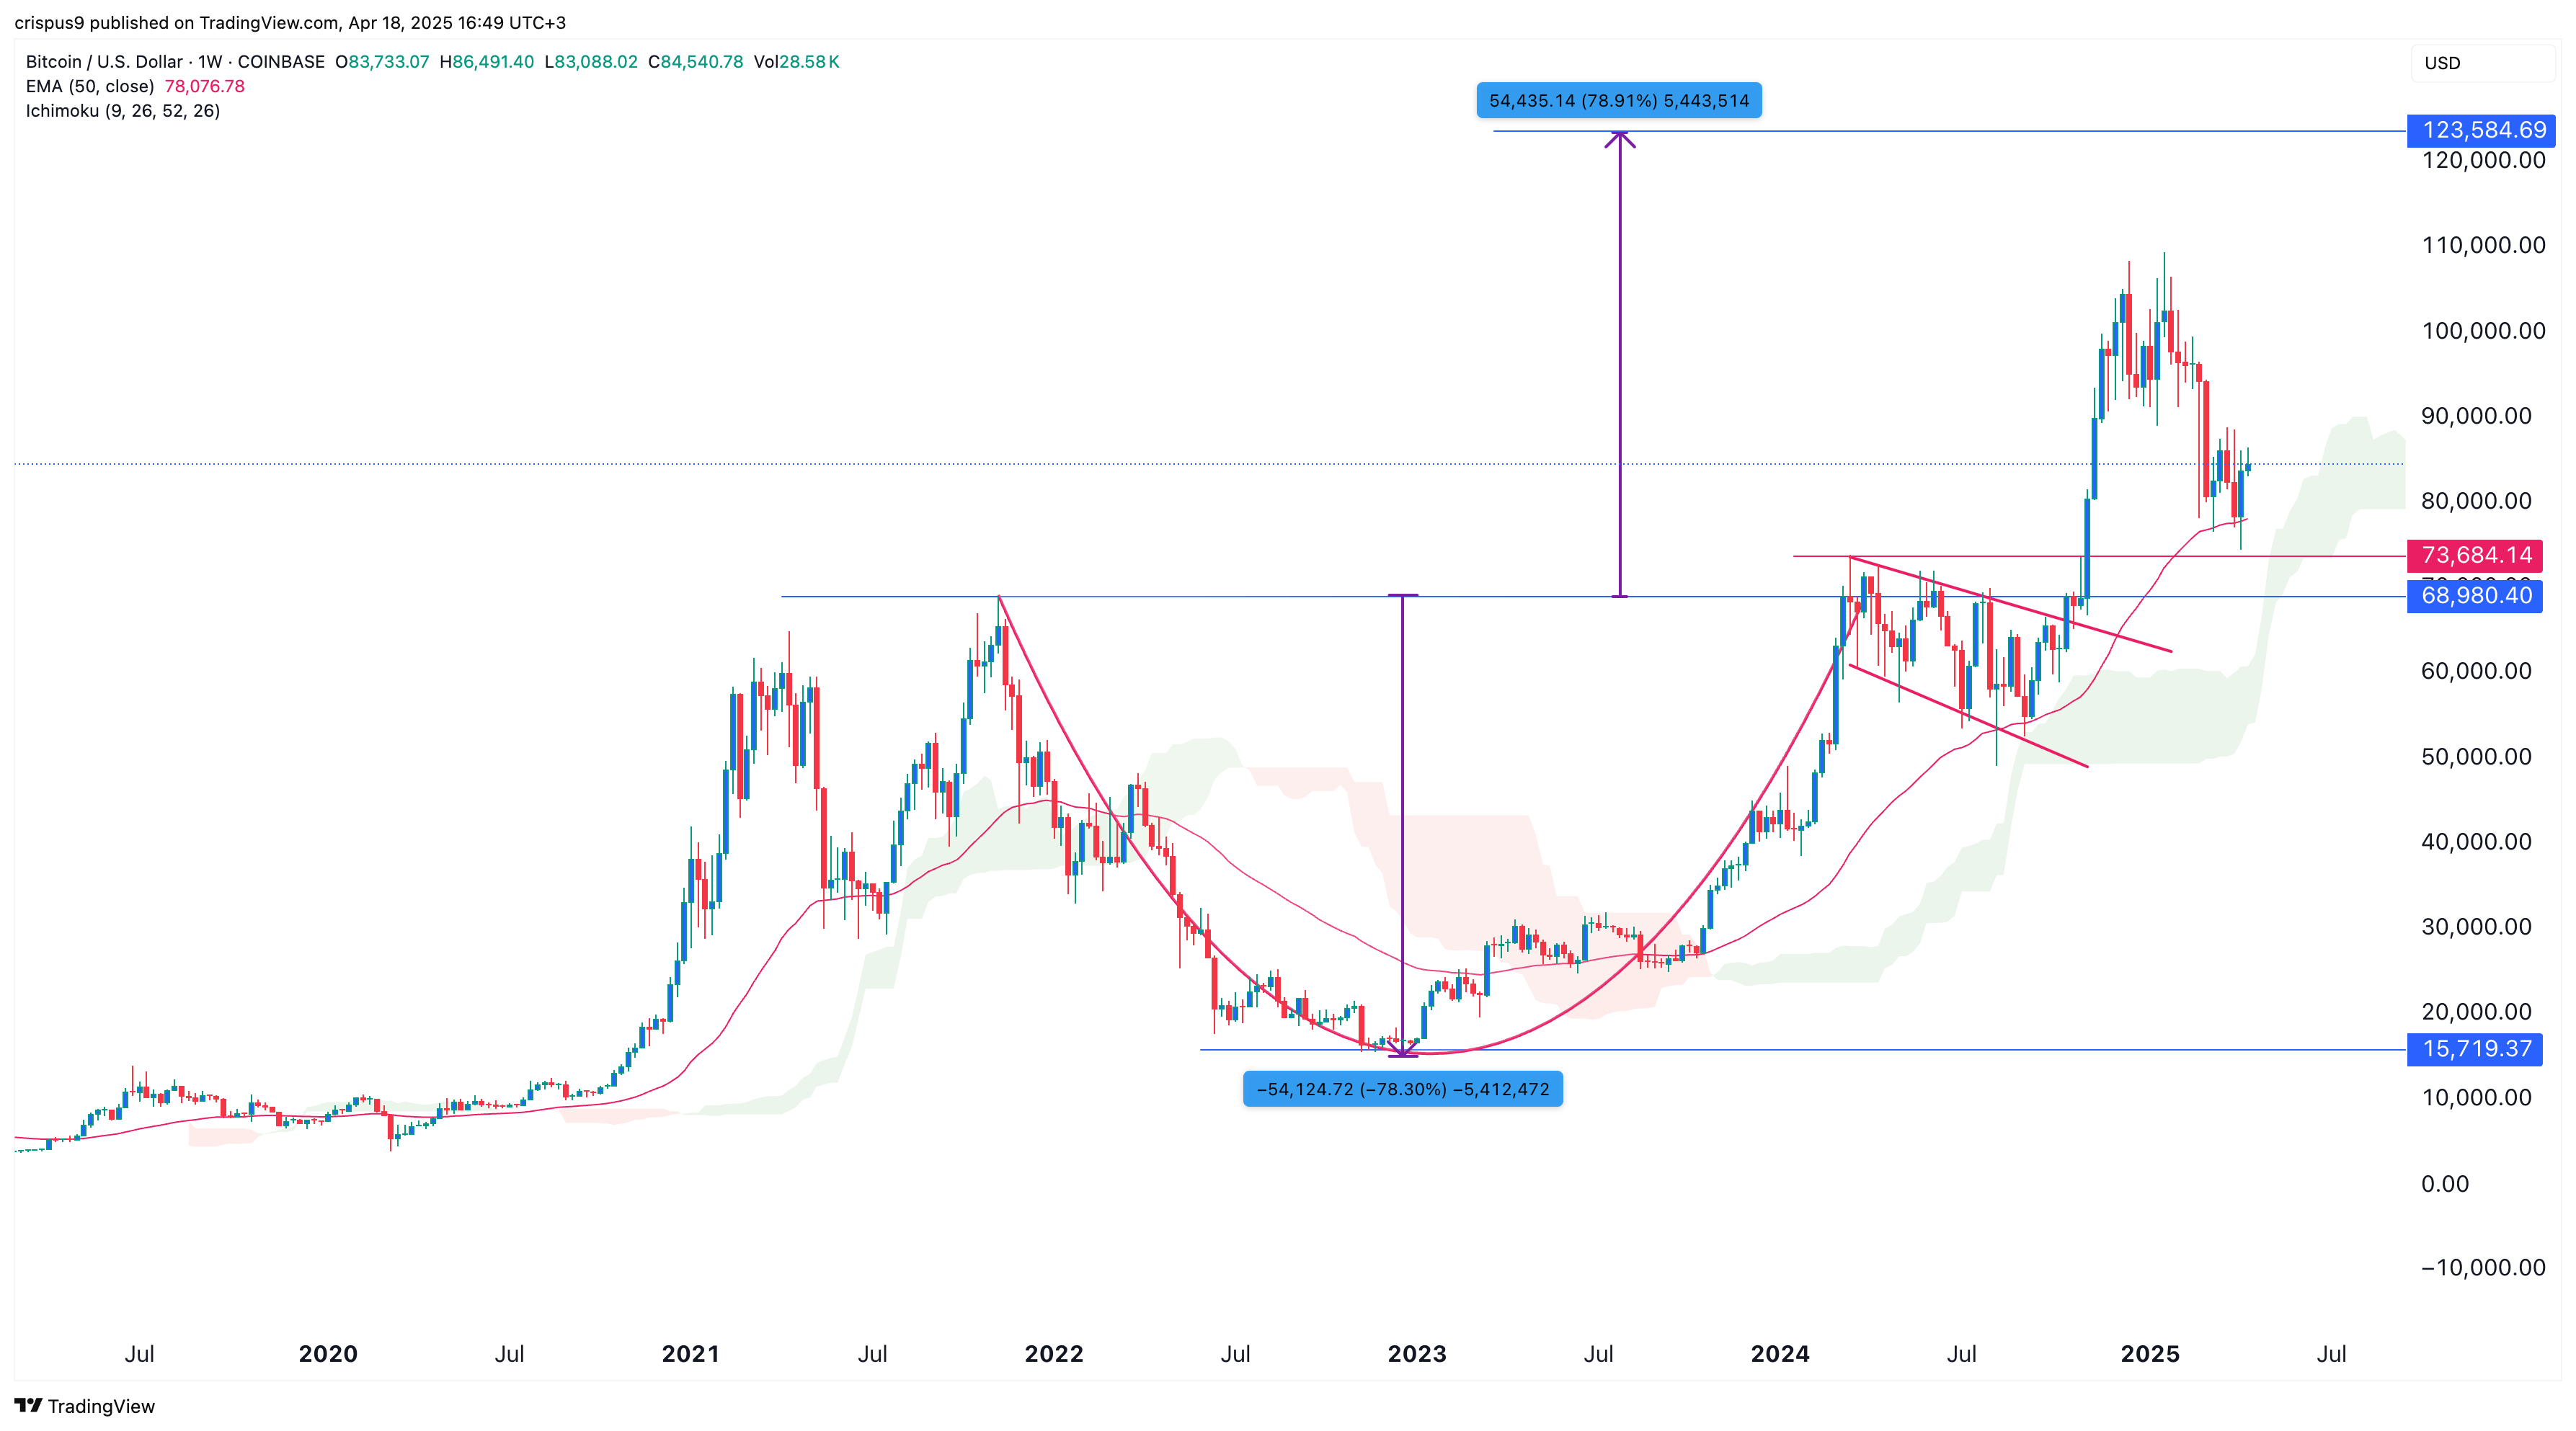
The weekly chart shows that BTC price is still in an uptrend despite the recent retreat. It has found support at the 50-week Exponential Moving Average, where it has failed to move below several times since October 2023.
Bitcoin has also remained above the Ichimoku Cloud indicator, a bullish sign. It has also moved above the key point at $73,685, the upper side of the cup-and-handle pattern which is a popular continuation signal.
This cup had a depth of 78%. Therefore, measuring the same distance from the cup’s upper side points to more gains to $123,585. This price is about 45% above the current level. A drop below the key support at $73,685 will invalidate the bullish outlook.