Bitcoin price pattern points to a $145k surge as exchange outflows rise


Bitcoin price remained in a tight range on May 4, but the ongoing demand and supply dynamics point to an eventual surge to a new all-time high.
Bitcoin (BTC) was trading at $104,000 on Wednesday, just 5.25% below its all-time high of $109,300. It has jumped nearly 40% from its lowest point in April.
The coin continues to see high demand, mostly from institutional investors. SoSoValue data shows that spot Bitcoin ETFs have added over $1.95 billion in inflows this year, bringing total inflows since inception to $41 billion.
Companies are also continuing their accumulation. Strategy spent $1.34 billion acquiring Bitcoin last week, bringing its total holdings to nearly $60 billion. Its market cap has now surged to over $115 billion.
Semler Scientific now holds 3,808 Bitcoins valued at $387 million, while Tether has also been accumulating — bringing total holdings by Twenty One to 36,312 coins. More companies are likely to continue buying Bitcoin after witnessing Strategy’s success.
Meanwhile, Bitcoin’s supply isn’t growing as fast, with mining difficulty and hash rate hitting record highs. Its supply on exchanges has dropped to a six-year low, continuing a trend that began in 2021. These dynamics will likely help support Bitcoin’s price in the long term.
Additionally, analysts have upgraded their stock forecasts following the truce between the US and China. Goldman Sachs expects the S&P 500 Index to rise to 6,500 as it lowers its recession odds from 45% to 35%. Such a move would likely benefit Bitcoin and other altcoins due to their correlation with equities.
Bitcoin price technical analysis
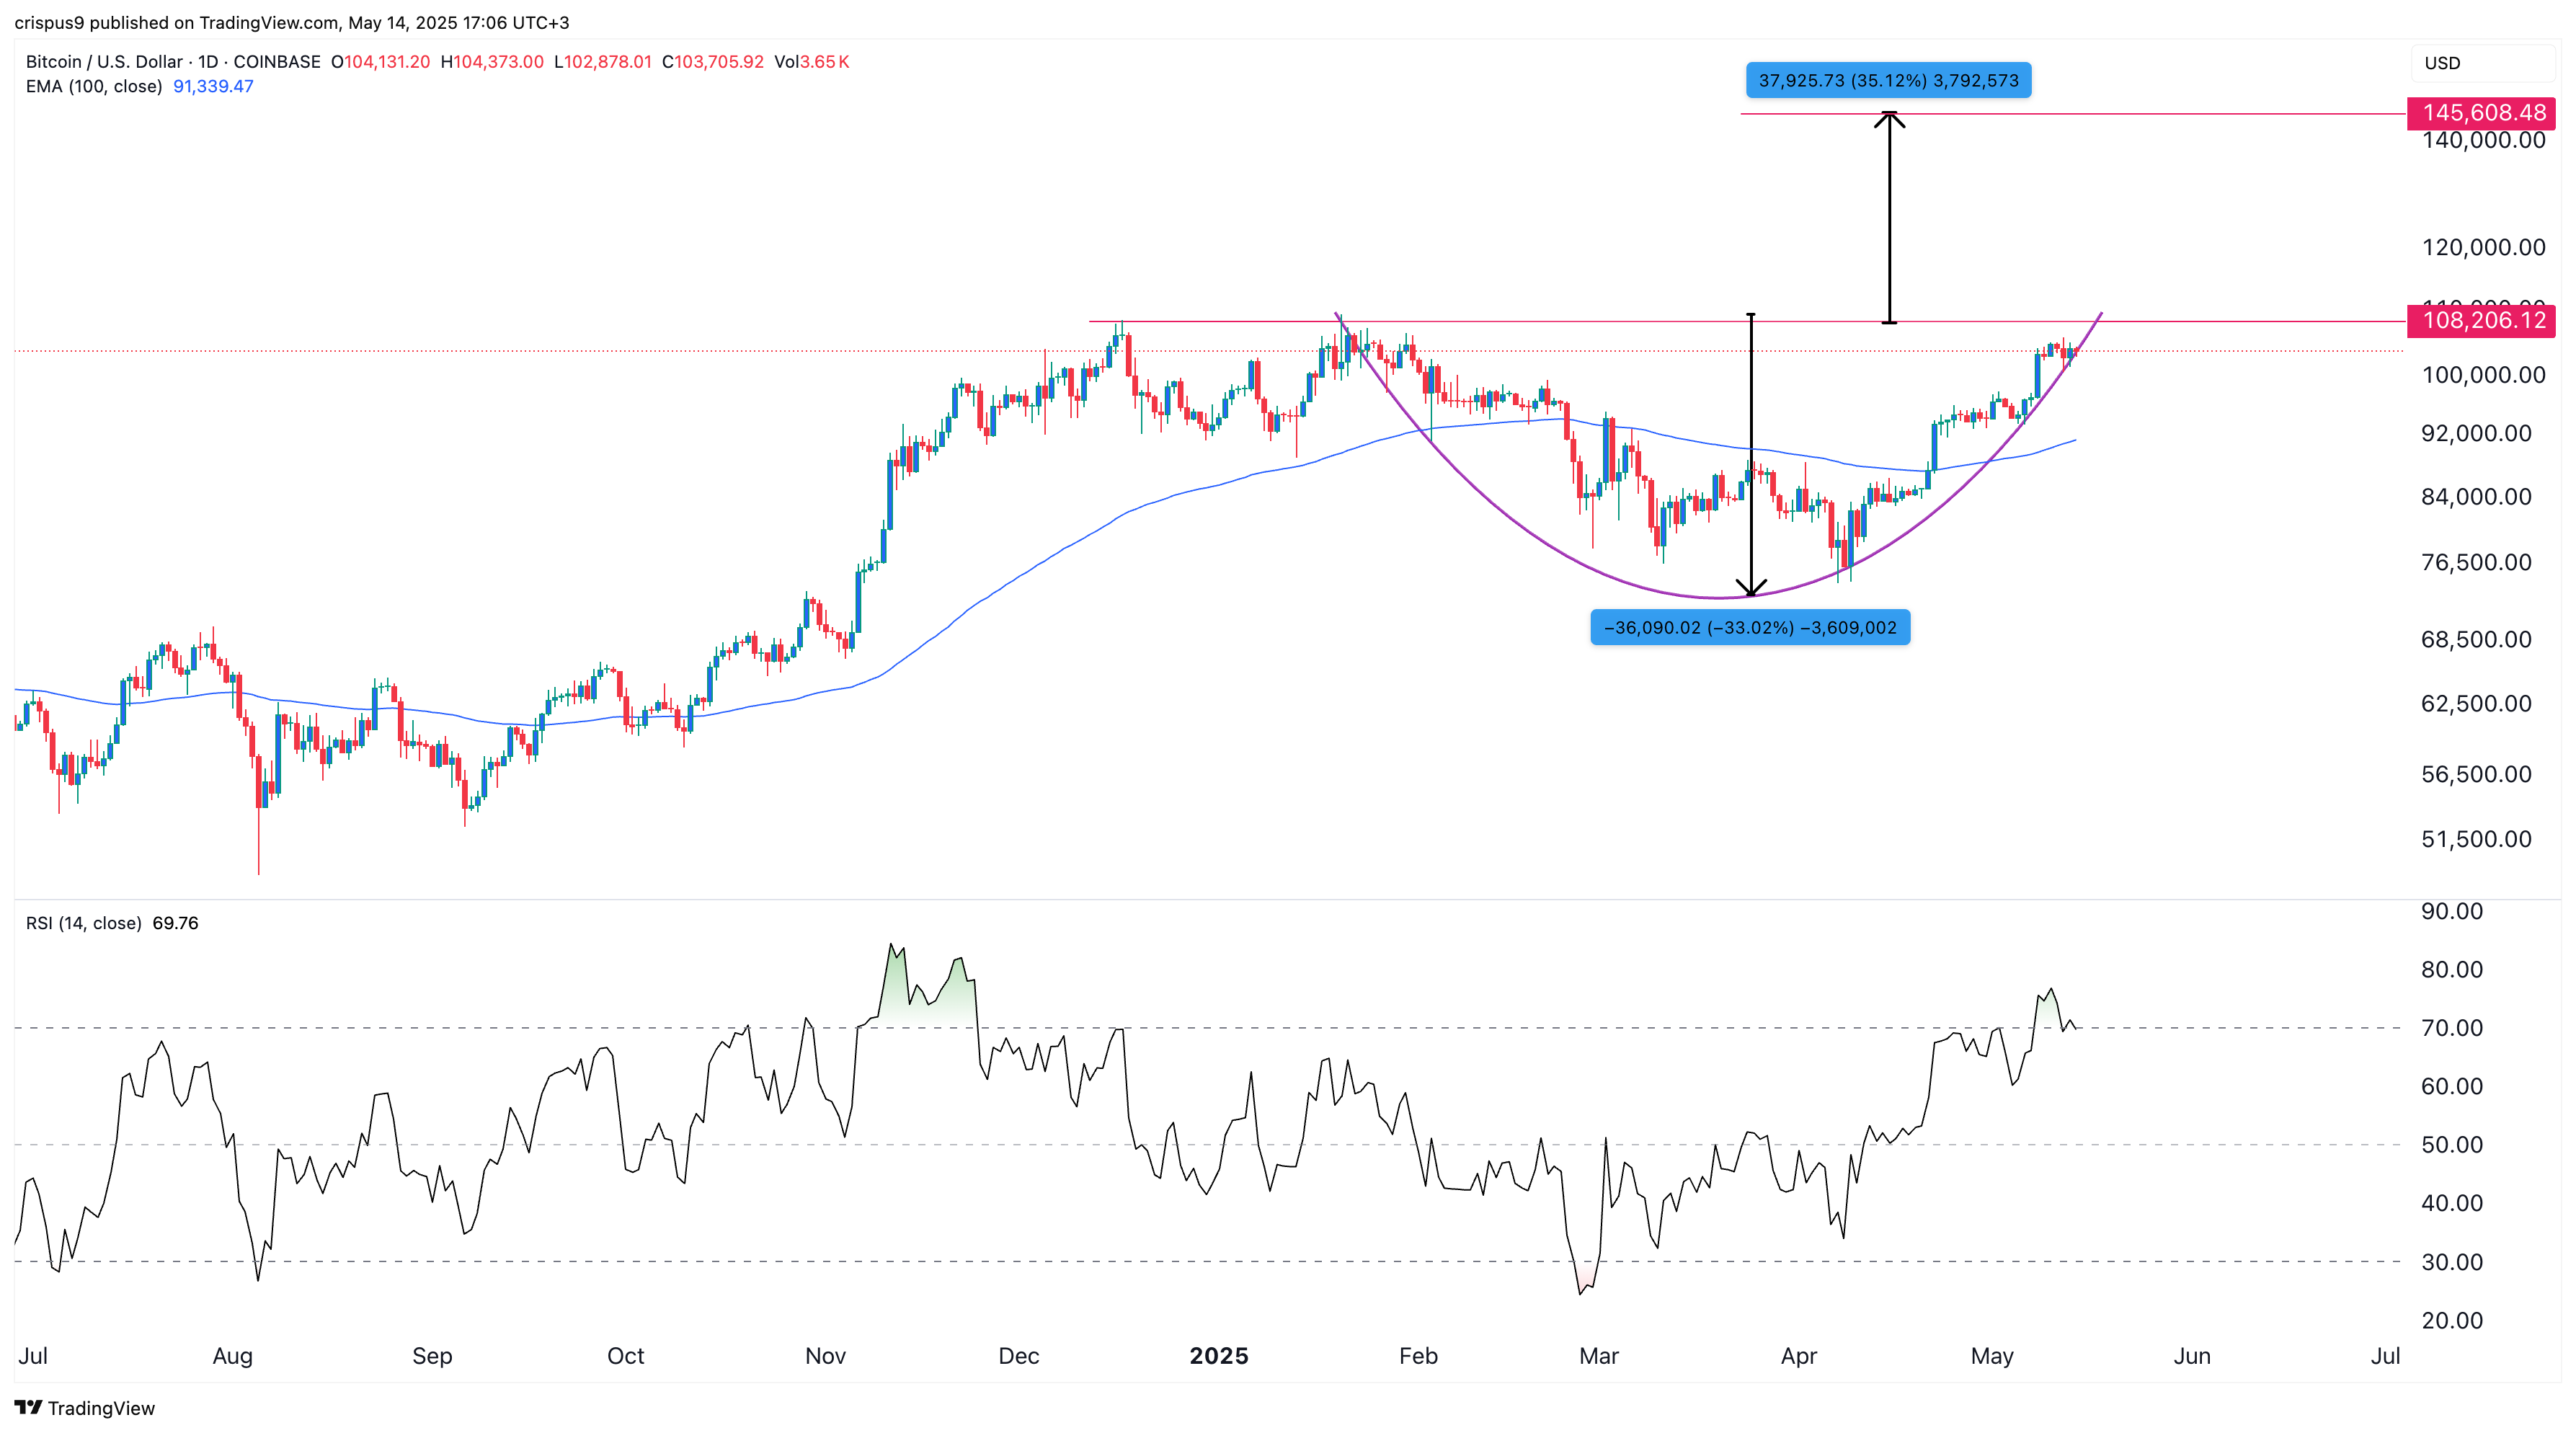
The daily chart shows that Bitcoin is gradually forming a cup-and-handle pattern, with the upper boundary at $108,200. A C&H pattern is a popular continuation signal in technical analysis.
This particular pattern has a depth of about 33%. Measuring the same distance from the cup’s upper side suggests a potential rally to $145,000. The bullish outlook will be confirmed once the BTC price breaks above the cup’s upper boundary.
On the flip side, a drop below the 100-day moving average at $91,340 would invalidate the bullish outlook.