Bitcoin price prediction: BTC at $68K as key metric drops — Is $60K next?

Bitcoin is showing increasing signs of structural weakness as both price action and on-chain metrics shift into what historically resembles early bear market conditions.
- Bitcoin has fallen to around $68,400 after breaking down from the $90,000–$95,000 range, signaling structural weakness.
- Data from CryptoQuant shows adjusted SOPR dropping to 0.92–0.94, a historical bear market stress zone where coins are spent at a loss.
- Technical indicators remain bearish, with resistance at $72,000 and $79,400, while key support sits at $64,000 and the $60,000–$62,000 zone.
At press time, Bitcoin (BTC) is trading around $68,400, following a sharp breakdown from the $90,000–$95,000 region earlier this year.
Bitcoin price enters stress zone as aSOPR signals bear market shift
Bitcoin may be transitioning into a broader bear phase, according to fresh on-chain data from CryptoQuant, which shows the Adjusted SOPR (aSOPR) falling back into a historically critical zone.
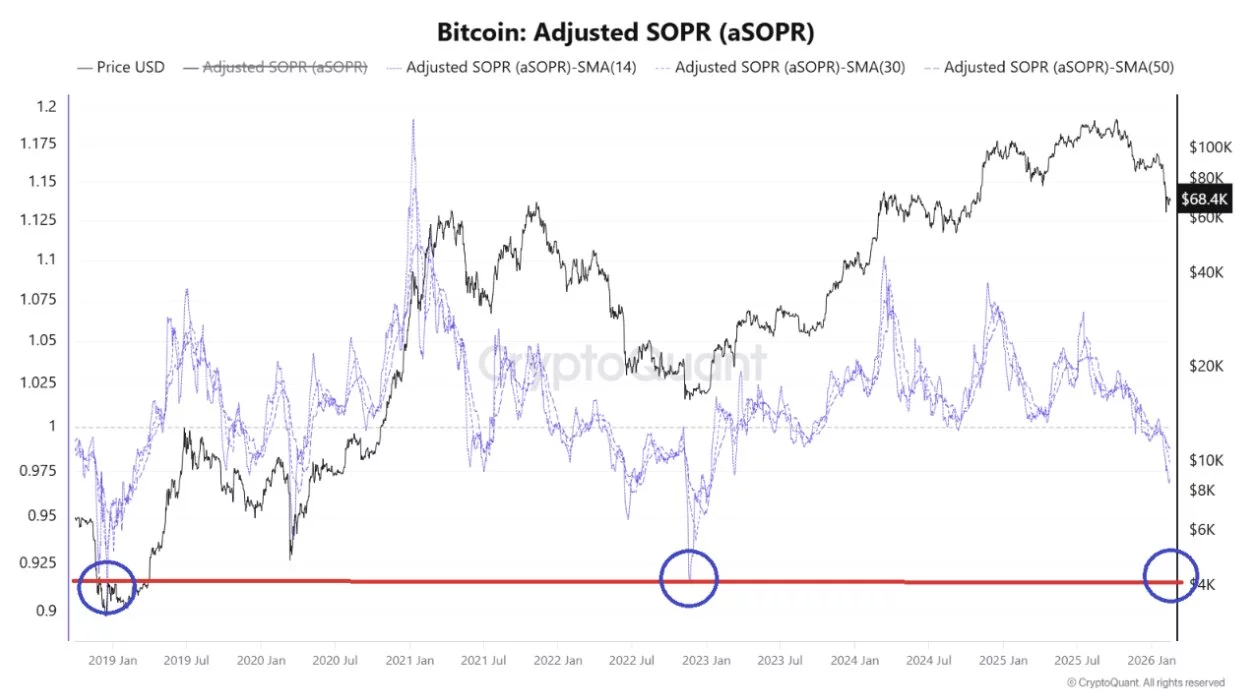
The aSOPR metric has dropped toward 0.92–0.94, a range that previously marked major stress points in 2019 and 2023. When aSOPR falls below 1.0, it indicates that coins are being spent at a loss, a sign of loss realization and weakening holder conviction.
In past cycles, sustained compression in the 0.92–0.93 region occurred during deep corrective phases and structural resets, not routine pullbacks.
Unlike mid-cycle dips where aSOPR quickly reclaims 1.0, the current move shows prolonged weakness. CryptoQuant notes that true market bottoms typically form only after deeper compression, peak loss realization, and exhaustion of selling pressure.
What the Bitcoin price charts show
For now, Bitcoin price appears to be entering stress territory, but not yet at full capitulation, raising the possibility that further downside may be needed before a durable reversal forms.
The daily chart shows a decisive loss of trend structure, with the Supertrend indicator flipping bearish and now positioned near $79,400, establishing a key resistance level.
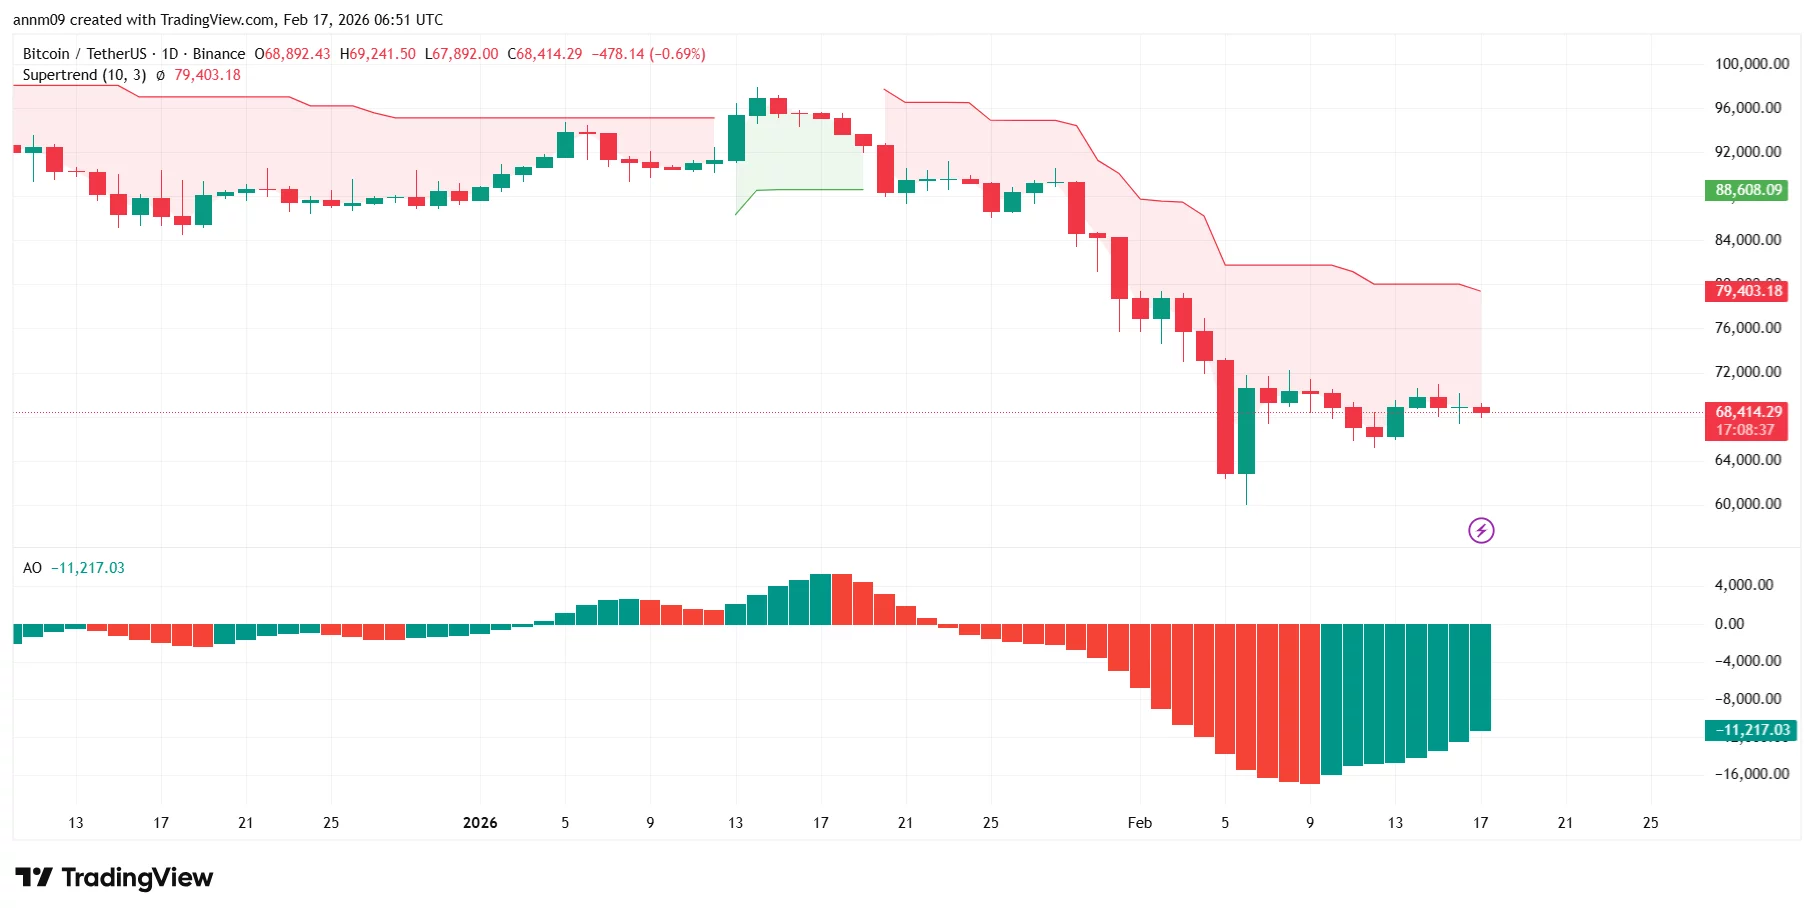
Price recently wicked into the low $60,000s before stabilizing, placing immediate support around $64,000, followed by the $60,000–$62,000 demand zone. Momentum indicators remain negative, though downside pressure is beginning to slow.
Unless Bitcoin can reclaim the $72,000 area and eventually the $79,400 trend resistance, the broader structure favors continued weakness. Combined with deteriorating on-chain signals, the setup increasingly resembles a regime shift rather than a temporary correction.