Bitcoin price prediction: Will ETF inflows drive BTC toward $120K?


- Bitcoin price prediction analysts note BTC is trading in the low-to-mid $114k level following a late-September rally.
- Spot-ETF flows have been mixed: prior weekly withdrawals were significant, but certain US ETFs lately had fresh daily inflows.
- Key short-term range: $108k-$116k; a break above the range leads to $118k-$120k (or higher in a protracted rally).
- Breakdown below $108k increases the likelihood of a move to $105k or lower.
- Structural market changes, such as increased derivatives open interest and larger institutional venues (for example, IBIT), raise both upside potential and tail-risk volatility.
The Bitcoin price prediction is back in focus as Bitcoin has recovered to the mid-$114k range following a tumultuous September, with recent market action shifting sentiment from consolidation to renewed bullish anticipation.
The move reflects a combination of variables, including spot-ETF flows that have at times boosted and drained liquidity, significant on-chain accumulation by major holders, and the building of derivatives positioning that can exacerbate moves in either direction.
Crypto market analysts are closely monitoring whether the late-September rally will pave the way for a sustainable Q4 advance or merely another round of volatility.
Table of Contents
Bitcoin price prediction: Current scenario
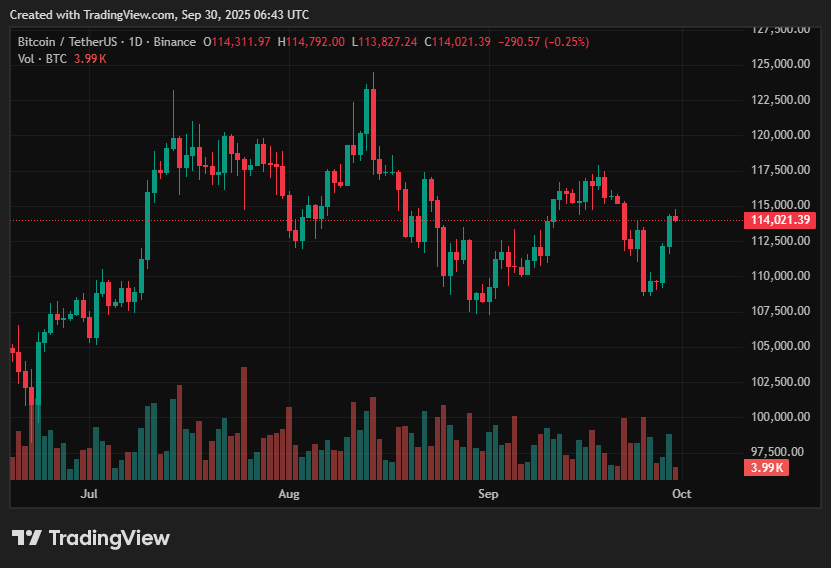
Bitcoin is currently trading in the low-to-mid $114k region, following a late-September increase in volume and bids; price feeds and recent reports place the level between $114.4k and $114.6k.
Markets are processing contradictory capital flows: while some weekly data revealed significant withdrawals from pooled products earlier this month, intraday and product-level activity has been inconsistent, with many US spot ETFs reporting fresh daily inflows.
At the same time, options and futures open interest have soared, and institutional venues (most notably IBIT) have swiftly expanded their presence in derivatives markets, resulting in a structural shift that alters how liquidations and gamma squeezes may unfold.
All of this is layered on top of usual technical zones: the market found support in the low-$109k range during recent falls and is now encountering clustering resistance across the $113k-$116k band, where recent supply has concentrated.
Upside outlook
On the upside, a clean break and hold above the mid-$116k level would improve the chart structure and potentially accelerate a push toward the $118k-$120k zone as leveraged short positions unwind and ETF demand boosts net buying.
Several market commentaries now identify Q4 as a window in which persistent institutional allocation could significantly re-rate prices, assuming flows continue favorably; under such a scenario, several analysts even sketch out considerably bigger year-end objectives, aligning with a cautiously bullish BTC price forecast.
Furthermore, massive on-chain accumulation by long-term and institutional whales, as well as declining exchange balances in recent snapshots, support the case for greater moves if buyer confidence remains strong.
Downside risks
The negative scenario for Bitcoin (BTC) is clear: failure to hold the low-$108k support zone would likely expose the mid-$100k level to fresh selling pressure, with $105k a reasonable nearer-term target on a deeper fall. Near-term risks include sporadic ETF outflows, miner or exchange selling, network update disputes, and macro shocks (central bank speech or unanticipated risk-off events) that can abruptly affect sentiment.
Seasonality, which has historically been unfavorable in September, combined with the risk of short, rapid liquidations when derivatives positioning is concentrated around important levels, suggests that elevated intraday volatility could be expected even if the broader Bitcoin outlook remains supportive.
Bitcoin price prediction based on current levels
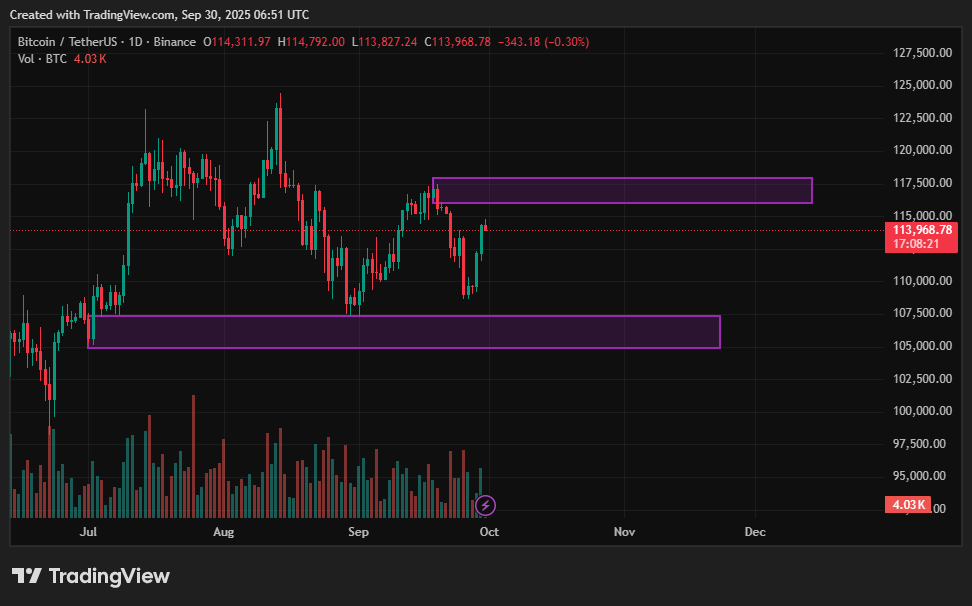
Given the current structure and flows, the operative near-term price band to watch is between $108k and $116k. As Bitcoin can maintain a move over the upper end of that range, the more likely path is a continuation toward $118k-$120k, with an extended bull scenario pushing prices to the mid-$120ks or higher as institutional allocation accelerates.
In contrast, a clear break below $108k would enhance the likelihood of a slide toward $105k and could reopen lower targets if macroeconomic conditions deteriorate. Overall, the balance of evidence now suggests a cautiously bullish leaning, subject to further ETF absorption and the absence of massive, disorderly selling, but traders should anticipate increased realized volatility as posture shifts.
This creates an expectation of near-term turbulence while maintaining a broader bullish projection toward higher price levels if supportive flows persist.
Disclosure: This article does not represent investment advice. The content and materials featured on this page are for educational purposes only.