Bitcoin price prediction: $10K swing on chart pattern imminent?


As traders keep a close eye on a possible head-and-shoulders pattern emerging on the daily chart, Bitcoin is consolidating around $111,000.
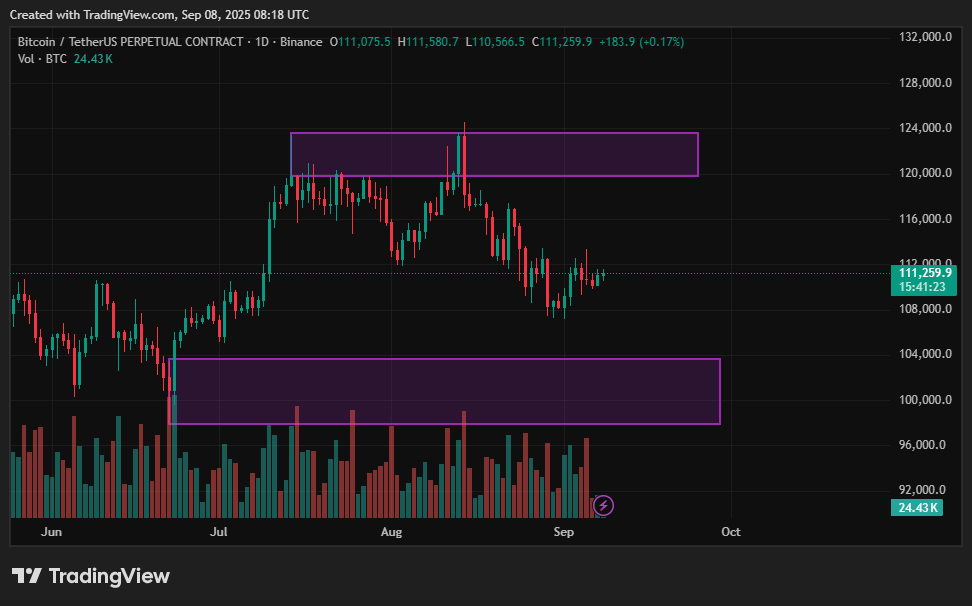
Depending on whether neckline support holds or fails, the setup suggests that a $10K price swing could be on the horizon.
- Bitcoin (BTC) consolidates around $111K, forming a possible head-and-shoulders pattern in this Bitcoin price prediction.
- ETF inflows and institutional demand add support to the bullish case.
- September’s historical volatility and macro uncertainty increase downside risks.
- Breakout above $112K could drive BTC toward $116K–$122K.
- Breakdown below $108K may trigger a drop to $100K–$101K.
The market is now delicately balanced between a bearish breakdown and a bullish continuation, as investors consider robust ETF inflows against the historical volatility of September. This Bitcoin price prediction highlights both upside and downside scenarios as the consolidation continues.
Table of Contents
Current BTC Price Scenario
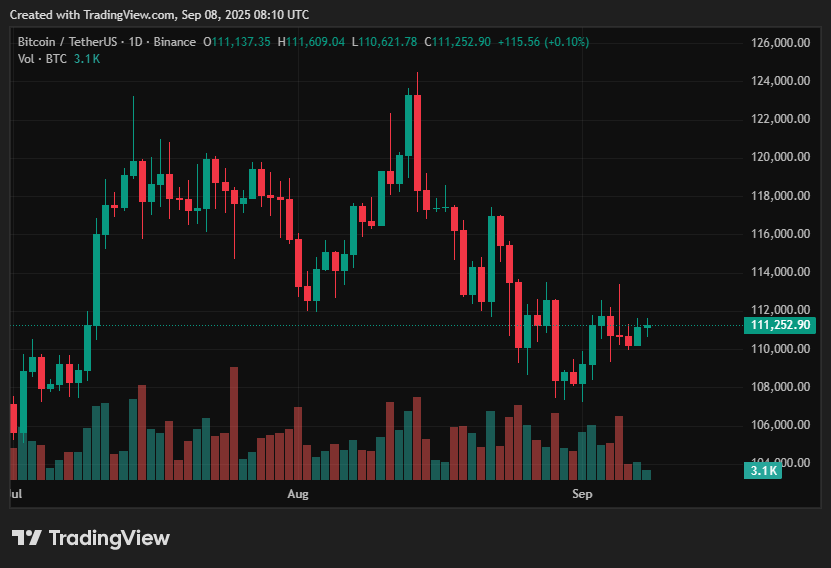
After the volatility of the previous week, Bitcoin is currently trading at about $111,356, exhibiting comparatively steady intraday movement. With resistance holding at $112K and support developing around $108K, the price has been stable around the $111K mark.
According to recent reports, Bitcoin is trapped in this narrow range as institutional accumulation and ETF inflows conflict with long-term holders’ desire to take profits. Traders are closely watching this level to refine their BTC price forecast for the coming weeks.
Upside Outlook
Bitcoin (BTC) still has a clear positive path if it can regain the $112K–$113K range with high purchasing volume, even with the current correction.
The head-and-shoulders pattern would be rendered worthless by a clear breakout above this level, with $116K–$118K as the target. Beyond there, a rise above $118K might complete a bullish turnaround by accelerating gains toward $121K–$122K.
Some analysts even point to a twin inverse head-and-shoulders pattern that, if neckline resistance is broken and institutional adoption supports momentum, could approach $150K in a larger supercycle. Peter Brandt, a seasoned trader, warns that the present neckline slope lessens the setup’s dependability and advises traders not to count on definite upside. This adds a cautious layer to the otherwise bullish Bitcoin outlook.
Downside Risks
However, if the $108K support level is broken, there is a considerable risk to the downside on the Bitcoin chart. A verified breakdown would support the head-and-shoulders neckline and indicate a measured $10K move below, with the $100K–$101K range as the objective.
Bitcoin has historically performed poorly in September, and the risk of volatility is increased by the mix of seasonal headwinds, macroeconomic uncertainty, and high derivatives positions. This scenario aligns with bearish expectations for a deeper retracement in the near term.
BTC Price Prediction Based on Current Levels
Overall, traders are waiting for a clear move as Bitcoin stays stuck in a neutral range between $108K and $112K–$113K. If ETF inflows continue at their current rate, a breakout over resistance would validate bullish continuation into the $116K–$122K range and possibly beyond.
On the other hand, a breach below support would position the market for a bearish swing into the $101K–$100K range, which is the head-and-shoulders formation’s measured goal.
Until price movement breaks this consolidation zone, the picture is still carefully balanced due to robust ETF inflows and mounting macro uncertainties. and suggest a measured $10K move lower, aiming for the $100K–$101K range.
Bitcoin has historically performed poorly in September, and the risk of volatility is increased by the mix of seasonal headwinds, macroeconomic uncertainty, and high derivatives positions.
Disclosure: This article does not represent investment advice. The content and materials featured on this page are for educational purposes only.