Bitcoin price fights to reclaim $95K resistance as implied volatility spikes double digits


Bitcoin price is trying to push its way back above the $95,000 mark after sinking to a local low near $89,000, a drop that sparked a sharp rise in implied volatility.
- Bitcoin price is attempting to break $95K after dropping from $126K all-time highs.
- Rising implied volatility and options skew indicate that traders are bracing for bigger swings.
- Technical indicators hint at a brief relief bounce, but the downtrend remains intact.
BTC was trading around $92,858 at press time, up about 1.8% on the day, but still down 9% over the past week and 14% over the past month. Since its Oct. 6 all-time high of $126,080, Bitcoin has now pulled back 26%.
Spot trading has slowed noticeably. Daily Bitcoin (BTC) trading volume dipped 2.3% to $83.8 billion, suggesting traders are stepping back and waiting for a clearer direction. Derivatives, however, tell a different story.
Futures volume is up nearly 15% to $123.2 billion, and open interest rose 3.9% to $67.4 billion. Rising open interest during a downturn typically means traders are hedging or leaning into short positions, not betting on a quick recovery.
On-chain signals show soft demand
A Nov. 19 GlassNode Insights report shows Bitcoin is now trading below the short-term holder cost basis and the −1 standard deviation band.
This puts many recent buyers in the red and makes the $95,000-$97,000 area a major resistance zone. The first indication that the market is regaining stability would be a clear move above that zone.
The report also notes significant increases in implied volatility across all maturities, the unwinding of speculative leverage, and large withdrawals from spot exchange-traded funds. With traders paying more for downside protection, especially around the $90,000 strike, the options skew is still strongly tilted towards puts.
At the same time, the DVOL index, which tracks how volatile options traders expect the market to be, has hit a monthly high, meaning bigger price swings could be coming.
Selling pressure has led to short-term holders’ realized losses reaching $523 million per day, their highest level since the FTX collapse. The next crucial level of support is the Active Investors’ Realised Price, which is approximately $88,600.
With $82,000 serving as the last significant structural support, a clear break below that level might trigger a more severe bearish phase.
Bitcoin price technical analysis
The chart shows Bitcoin trading below all major moving averages, with the Bollinger Bands widening as price rides the lower band. This indicates strong downward momentum and a market looking for support. At 36, the relative shows that there is little momentum but not yet severe oversold conditions.
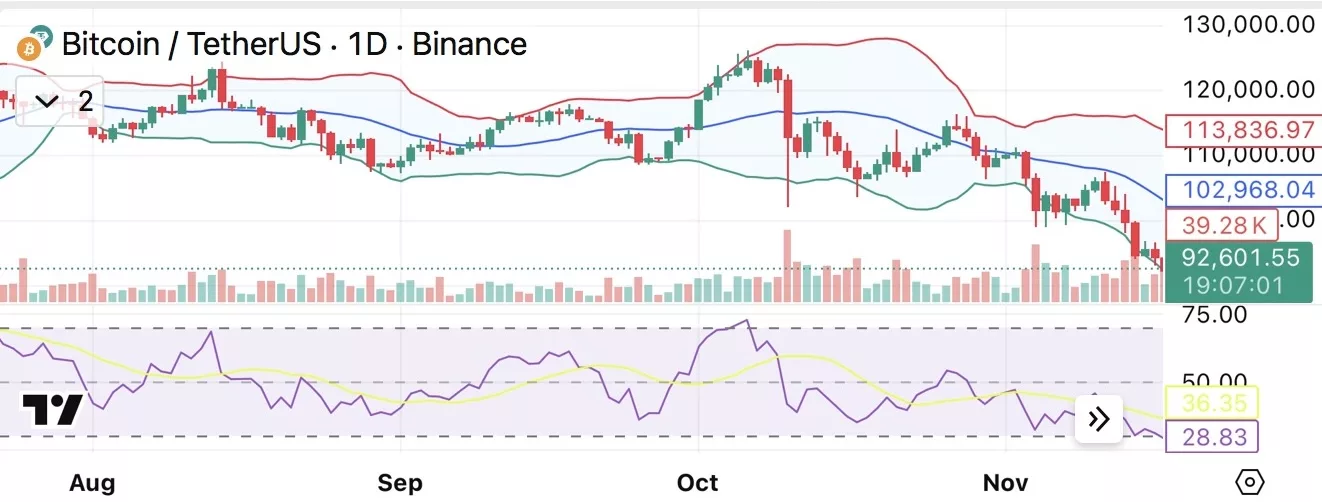
Most indicators are sitting in neutral territory, but a few are starting to show some bullish signs. The commodity channel index and Momentum have both turned positive, suggesting that if volatility eases, we could see a short-lived relief bounce. Still, the MACD remains deeply negative, and the average directional index at 40 shows the downtrend is still firmly in place.
For sentiment to shift, Bitcoin needs to close back above $95,000, and ideally $97,000. If it can’t reclaim those levels, the market remains at risk of another retest of $90,000, with a possible slide into the high-$80,000 range if sellers take control again.