Bitcoin price risks drop to $65,000 as weekly trend shifts bearish


Bitcoin price is losing its weekly structure after a sharp rejection at channel resistance, raising the probability of a deeper corrective move toward $65,000 support.
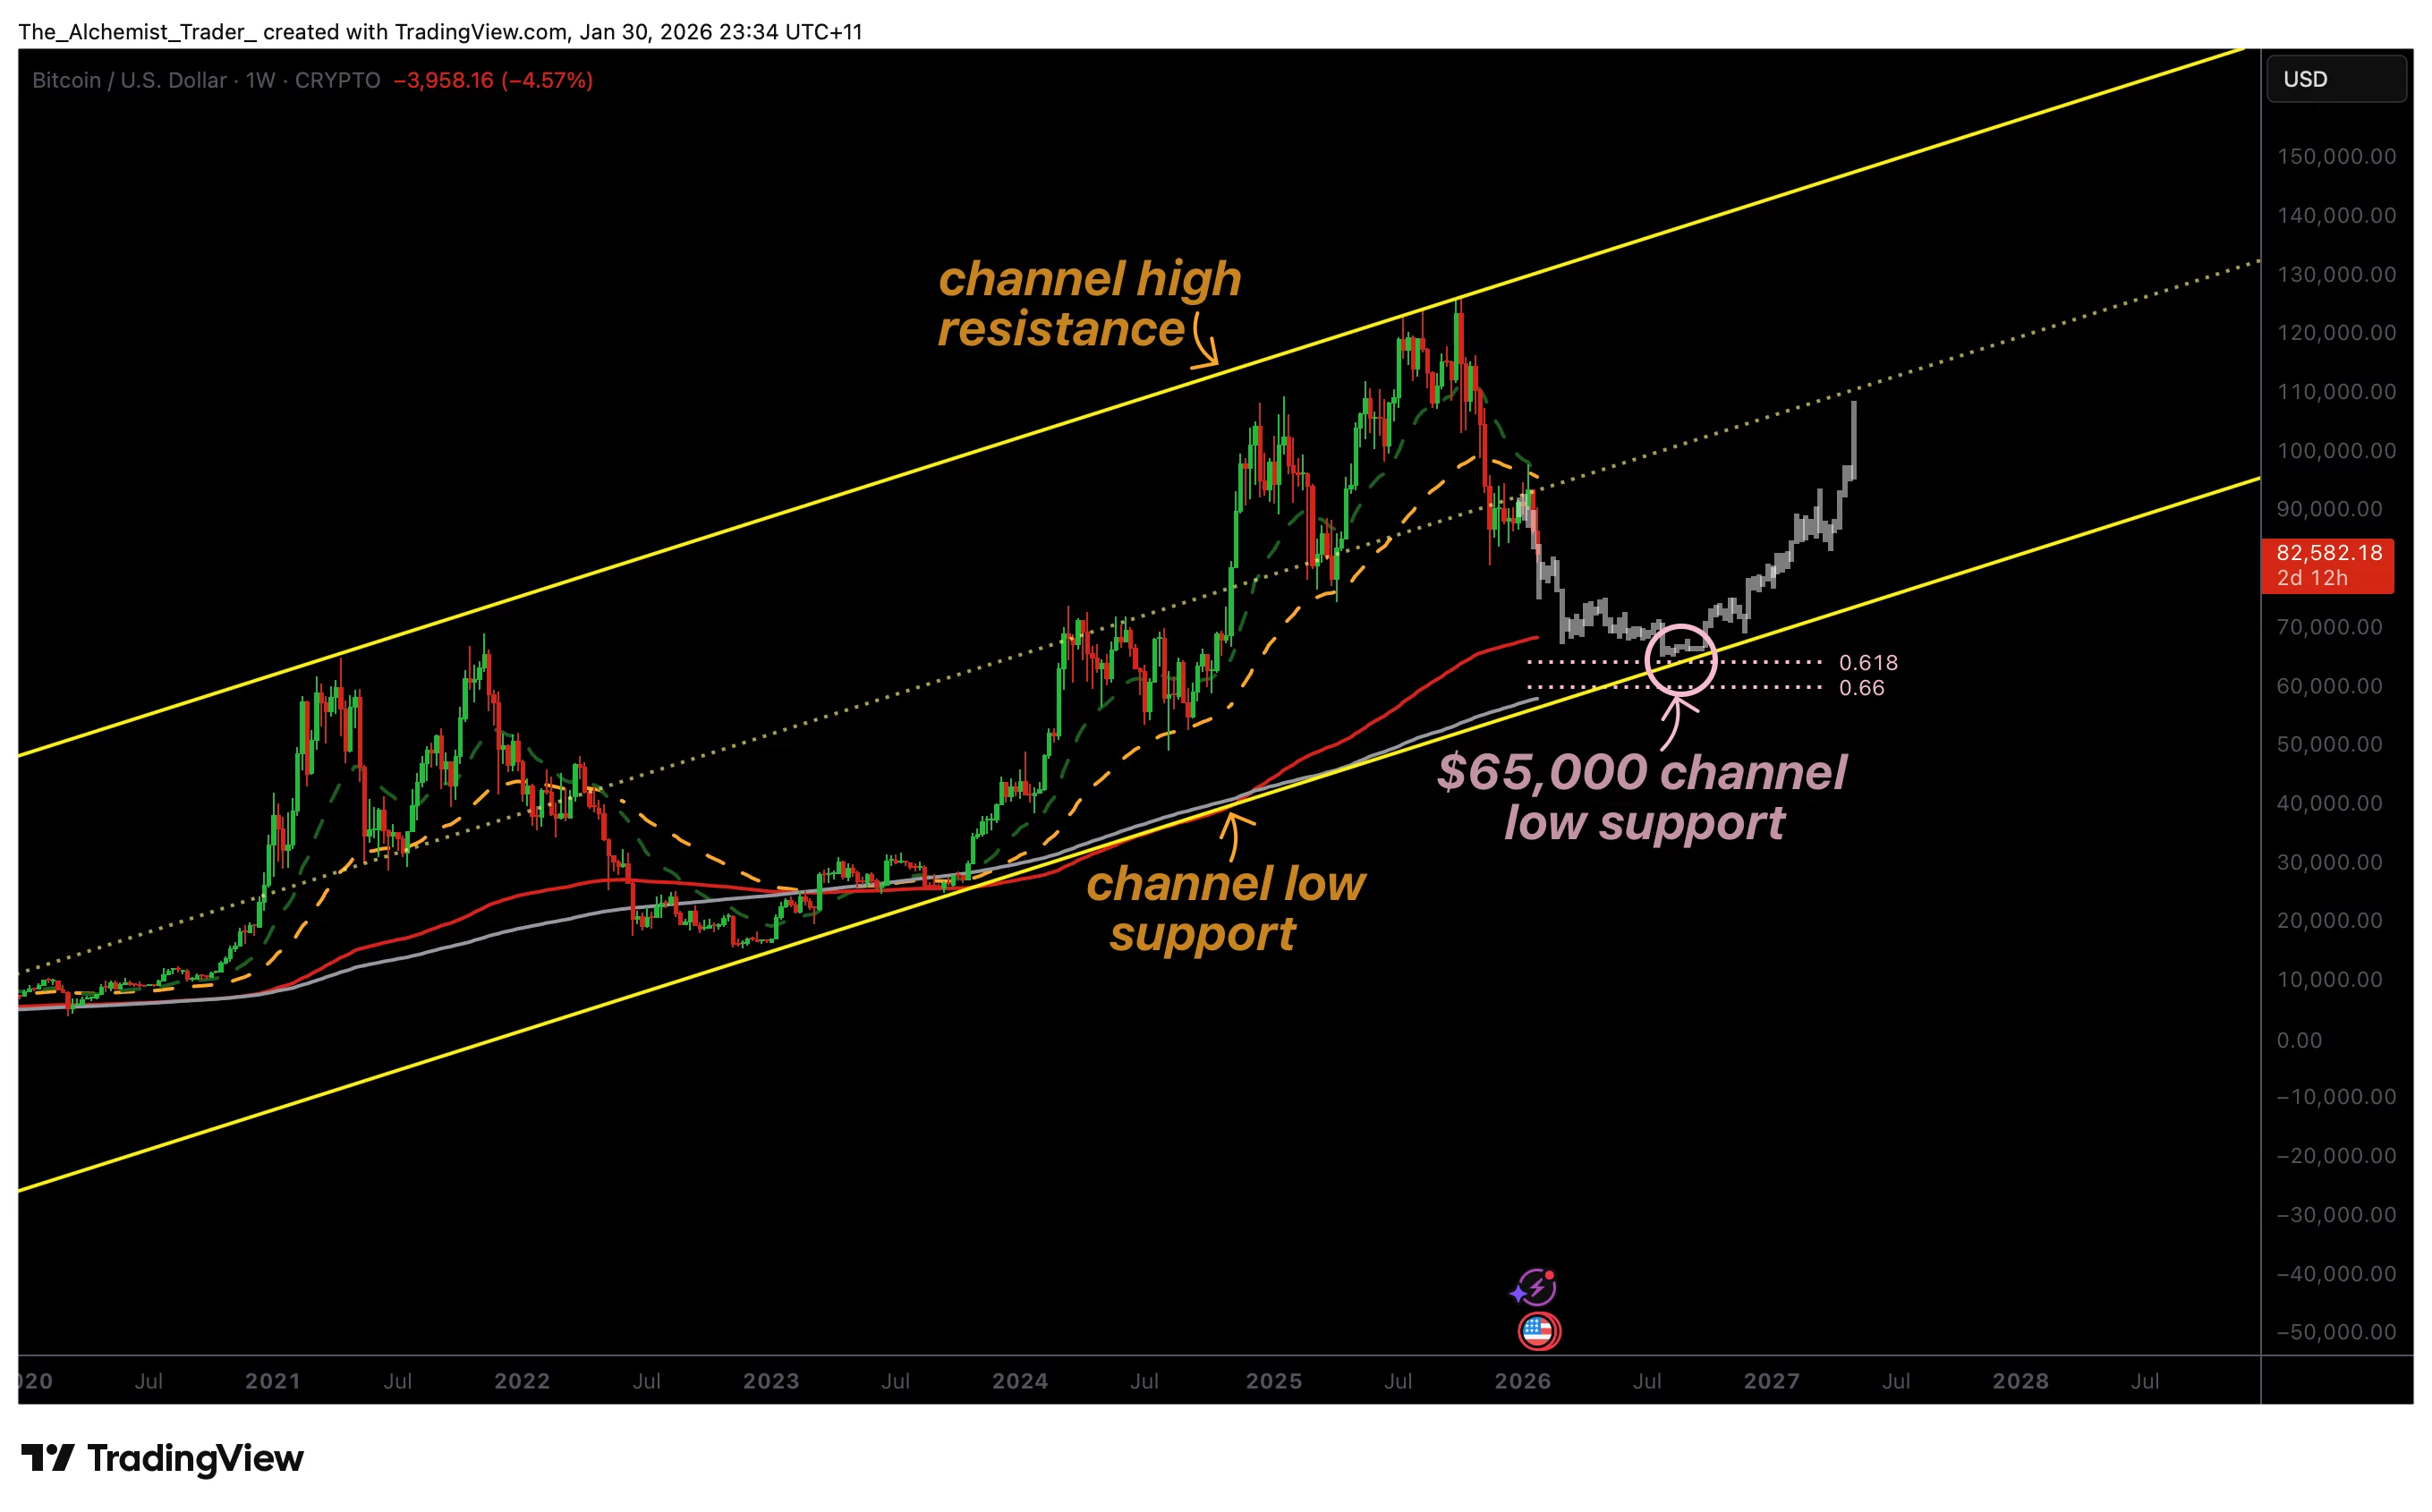
- Bitcoin was rejected at channel high resistance, triggering downside momentum.
- The range midpoint has been lost on a weekly closing basis.
- $65,000 channel low and the 200-week moving average are key downside targets.
The current Bitcoin (BTC) price is hovering at $83,000. It’s a critical phase as the higher-time-frame structure continues to weaken. After failing decisively at the upper boundary of a long-standing trading channel, the price has transitioned into an impulsive corrective move that is now reshaping the weekly outlook.
The loss of key levels has shifted momentum firmly in favor of sellers, increasing the probability that Bitcoin will rotate lower toward major structural support. With the weekly trend turning bearish, a downside continuation toward the channel low is becoming the more likely scenario.
Bitcoin price key technical points
- Channel high rejection confirmed: Price was rejected precisely at long-term resistance.
- Range midpoint lost on a closing basis: Signals structural weakness.
- $65,000 channel low in focus: Confluence with the 200-week moving average.
Bitcoin’s recent decline began with a clean rejection at the range high, also referred to as channel high resistance. This level has historically acted as a ceiling for price, and the most recent test was no exception. Sellers stepped in aggressively, triggering a sharp bearish expansion away from resistance.
The rejection was not shallow or indecisive. Instead, it produced strong downside momentum, suggesting that the rally into resistance was corrective rather than the start of a new bullish leg. This reaction set the tone for the current move lower.
Loss of range midpoint confirms weakness
Following the rejection, Bitcoin rotated toward the range midpoint, a level that often acts as a battleground between buyers and sellers. Importantly, this level has now been lost on a weekly closing basis, a development that significantly weakens the bullish case.
Closing below the midpoint shifts control back to sellers and opens the path for price to explore deeper parts of the range. From a market structure perspective, this loss confirms that the corrective move has more room to develop rather than resolving quickly.
Weekly trend turns bearish
With price failing to reclaim key levels, the weekly trend has officially shifted bearish. Bitcoin is now printing consecutive lower highs and lower lows, a defining characteristic of a downtrend. As long as this structure remains intact, rallies are more likely to be corrective and sold into rather than sustained.
This structural shift increases the probability that the current move is not a short-lived pullback but part of a broader corrective phase within the larger channel.
$65,000 emerges as a downside magnet
The next major technical objective sits at the channel low near $65,000. This level represents long-term structural support and has repeatedly acted as a reaction zone throughout Bitcoin’s multi-year trading history. Given the current bearish momentum, the price is increasingly drawn toward this area.
Markets often gravitate toward such well-defined levels, particularly when intermediate support fails. In this context, $65,000 acts as a magnet for price, where liquidity, historical demand, and long-term positioning converge.
200-week moving average adds confluence
Adding to the significance of the $65,000 region is the presence of the 200-week moving average, one of the most closely watched indicators in Bitcoin’s long-term trend analysis. Historically, retests of the 200-week average have often coincided with major cycle bottoms or extended consolidation phases.
While this does not guarantee an immediate reversal, it does suggest that a base-building process is likely once price reaches this zone. Such bases often take time to develop, involving volatility and sideways movement rather than a sharp V-shaped recovery.
Correction does not equal trend failure
It is important to distinguish between a deep correction and a complete breakdown of Bitcoin’s long-term thesis. Even within broader bullish cycles, Bitcoin has repeatedly experienced large drawdowns that reset structure and sentiment before the next expansion phase.
From a higher-time-frame perspective, a move toward $65,000 would still fit within Bitcoin’s historical behavior, particularly given the extended period price has spent trading within this large structural channel.
What to Expect in the Coming Price Action
Bitcoin remains in a bearish corrective phase as long as price stays below the range midpoint and continues to print lower highs on the weekly timeframe. The probability favors continued downside rotation toward $65,000 channel low support, where the 200-week moving average may provide a stabilizing influence.
Until that region is reached and structure improves, rallies are likely to face selling pressure. The coming weeks will be defined by whether Bitcoin completes this corrective move and begins forming a long-term base, or whether bearish momentum accelerates further before support is established.