Bitcoin price eye $117K breakout as sell pressure drops


After a turbulent start to September, Bitcoin is still trading just above $115,000, and sell pressure indicators point to a possible accumulation phase.
- Bitcoin price is consolidating above $115K after a brief dip, with sell pressure showing signs of easing.
- Accumulation is picking up, suggesting stronger hands are absorbing supply ahead of the next move.
- Resistance at $117K remains key — a breakout could open the way to $124K, while failure risks retesting lower supports.
Bitcoin is currently trading at $115,954, down 0.5% over the previous day. Weekly values have ranged from $110,870 to $116,705, which puts the asset 6.6% below its peak of $124,128 on Aug. 14.
Although it is still down 2% over the last 30 days, Bitcoin (BTC) has increased 3.4% over the last week. A 46.7% increase in daily trading volume to $45.1 billion from the previous day suggests that market activity has resumed.
Derivatives also saw momentum, with volume rising 42.18% to $75.28 billion, though open interest dipped slightly by 1.32%, suggesting traders may be cautious about taking new positions.
Analysts flag easing Bitcoin sell pressure
On Sept. 16, crypto analyst Ali Martinez noted that Bitcoin’s Sell-Side Risk Ratio had dropped below 0.1%, a level often associated with local bottoms, reduced sell pressure, and accumulation phases. Additionally, he pointed out that $116,963 is a crucial supply wall where sellers might try to profit if Bitcoin keeps rising.
Meanwhile, CryptoQuant contributor Arab Chain pointed to a sharp rise in the Bitcoin Scarcity Index on Binance, the first spike since June. When exchange supply thins out, either as a result of large investor withdrawals or a decline in sell orders, this index often rises. When this last happened, Bitcoin rose to $124,000.
However, Arab Chain cautioned that if the spike fades quickly, it could reflect speculative activity rather than sustained buying. A prolonged positive reading, by contrast, could confirm the beginning of a strong accumulation phase.
Bitcoin price technical analysis
On its daily chart, Bitcoin shows consolidation just below resistance at $117,525, and it is currently trading near the upper Bollinger Band. While the relative strength index, which is at 58, indicates neutral momentum, the Momentum and MACD indicators flash buy signals, indicating a bullish short-term scenario.
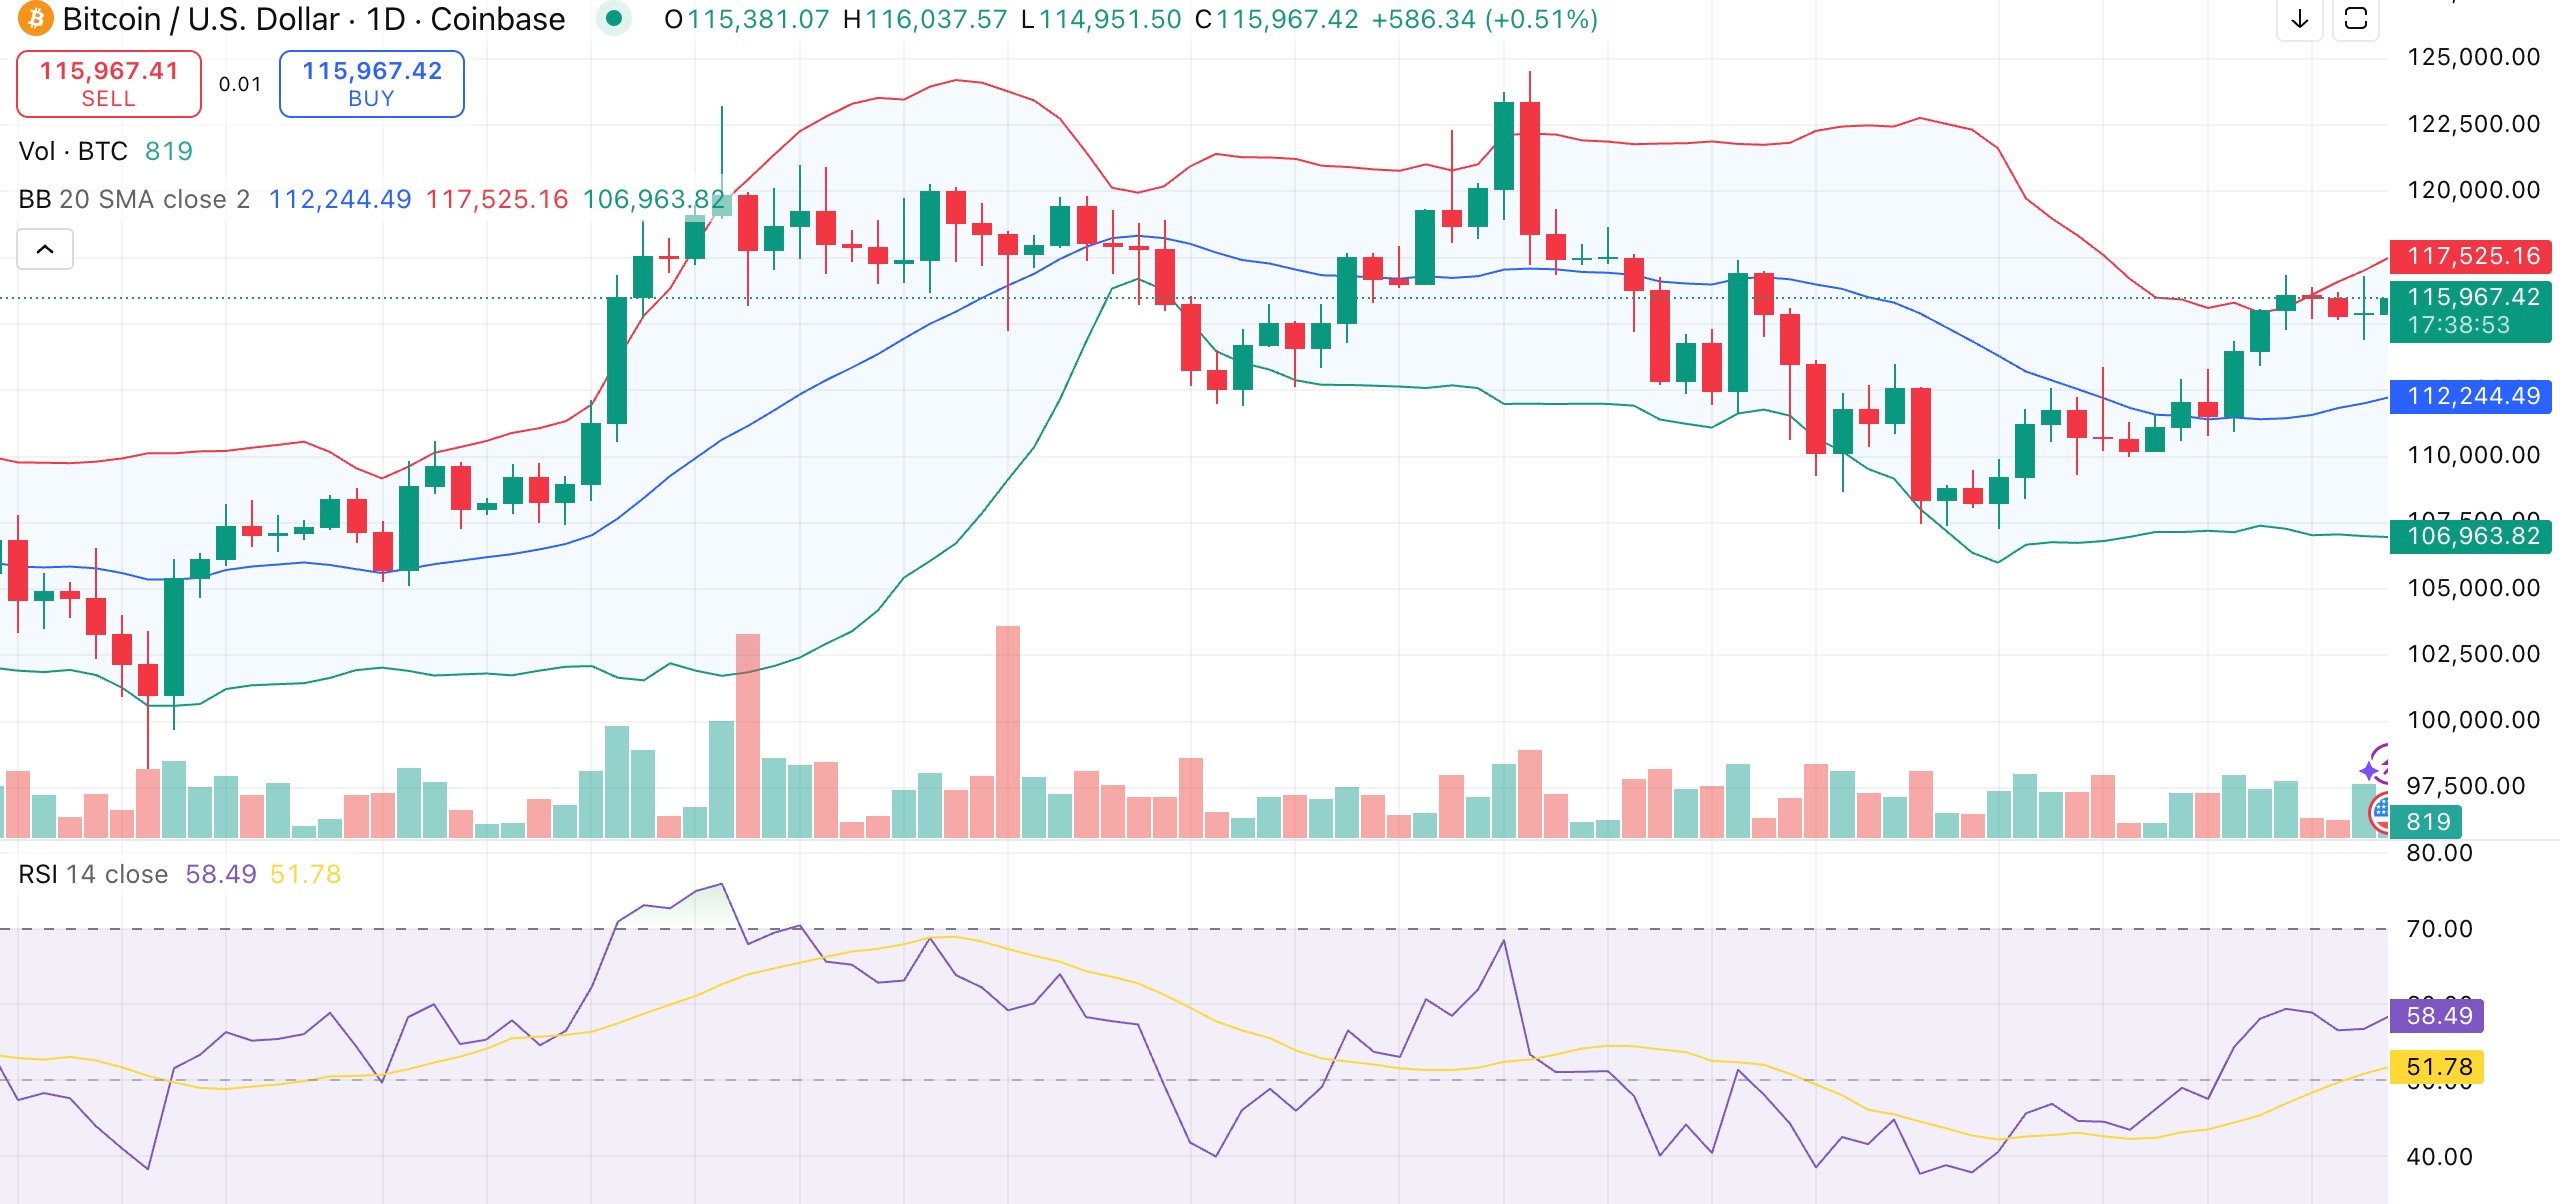
Moving averages continue to be very supportive as Bitcoin trades above its 50-, 100-, and 200-day levels, all of which flash “buy.” This alignment indicates underlying strength, even though the commodity channel index and stochastic RSI point to overbought conditions and the possibility of a brief decline.
If Bitcoin breaks above the resistance level between $116,963 and $1117,525, it might retest its all-time high of $124,128 from August. However, the price may return to support at $112,244 and perhaps $106,963 if this is not done.