Bitcoin price tests lower range support as spot BTC ETFs return to net outflows


Bitcoin price slipped lower on Oct. 16, testing key support around $111,000 as spot Bitcoin exchange-traded funds swung back to net outflows after a brief return to inflows.
- Bitcoin trades around $111K as BTC spot ETFs record $94M in outflows.
- Trading volume and derivatives activity signal cautious sentiment.
- Dovish Fed tone offers hope for renewed upside momentum.
As of this writing, Bitcoin was trading close to $111,673, down 8% over the previous week and 0.5% over the previous day. Trading volume has fallen sharply to $66.2 billion, a drop of more than 27% in a single day, suggesting that market participation is thinning
CoinGlass data shows that Bitcoin (BTC) open interest decreased slightly to $72 billion, while derivatives volume dropped 35.5% to $92.5 billion. This combination typically indicates that traders are closing leveraged positions and waiting for clearer signals before re-entering the market.
Spot BTC ETF outflows signal renewed caution
According to SoSoValue data, U.S. spot Bitcoin ETFs recorded $94 million in net outflows on Oct. 15, led by Grayscale’s GBTC with $82.9 million withdrawn. Invesco and BlackRock followed with smaller outflows.
After nine straight sessions of inflows, ETFs saw their first major redemptions on Oct. 13. The latest reversal followed net inflows of $102.6 million on Oct. 14, indicating that institutional appetite is still hesitant.
BTC options market flips bearish
Data from Greeks.live shows a notable rise in short-term bearish activity in the Bitcoin options market. With strike prices ranging from $104,000 to $108,000, put options made up 28% of all trading volume.
Since longer-term metrics are neutral and traders are hedging against short-term downside, this indicates temporary caution rather than a structural bearish shift.
In the medium term, macro conditions continue to be supportive. Fed Chair Jerome Powell’s remarks on Oct. 14 bolstered expectations of a rate cut at the end of the month. Lower rates could boost liquidity and favor risk assets like Bitcoin.
Yet, growing trade tensions between the U.S. and China as well as tariff increases present possible obstacles, keeping risk sentiment fragile.
Bitcoin price technical analysis
Bitcoin is still trading within the lower Bollinger Band on the daily chart, consolidating close to its short-term support between $110,000 and $111,000. At 42, the relative strength index indicates neutral momentum but is moving closer to oversold territory.
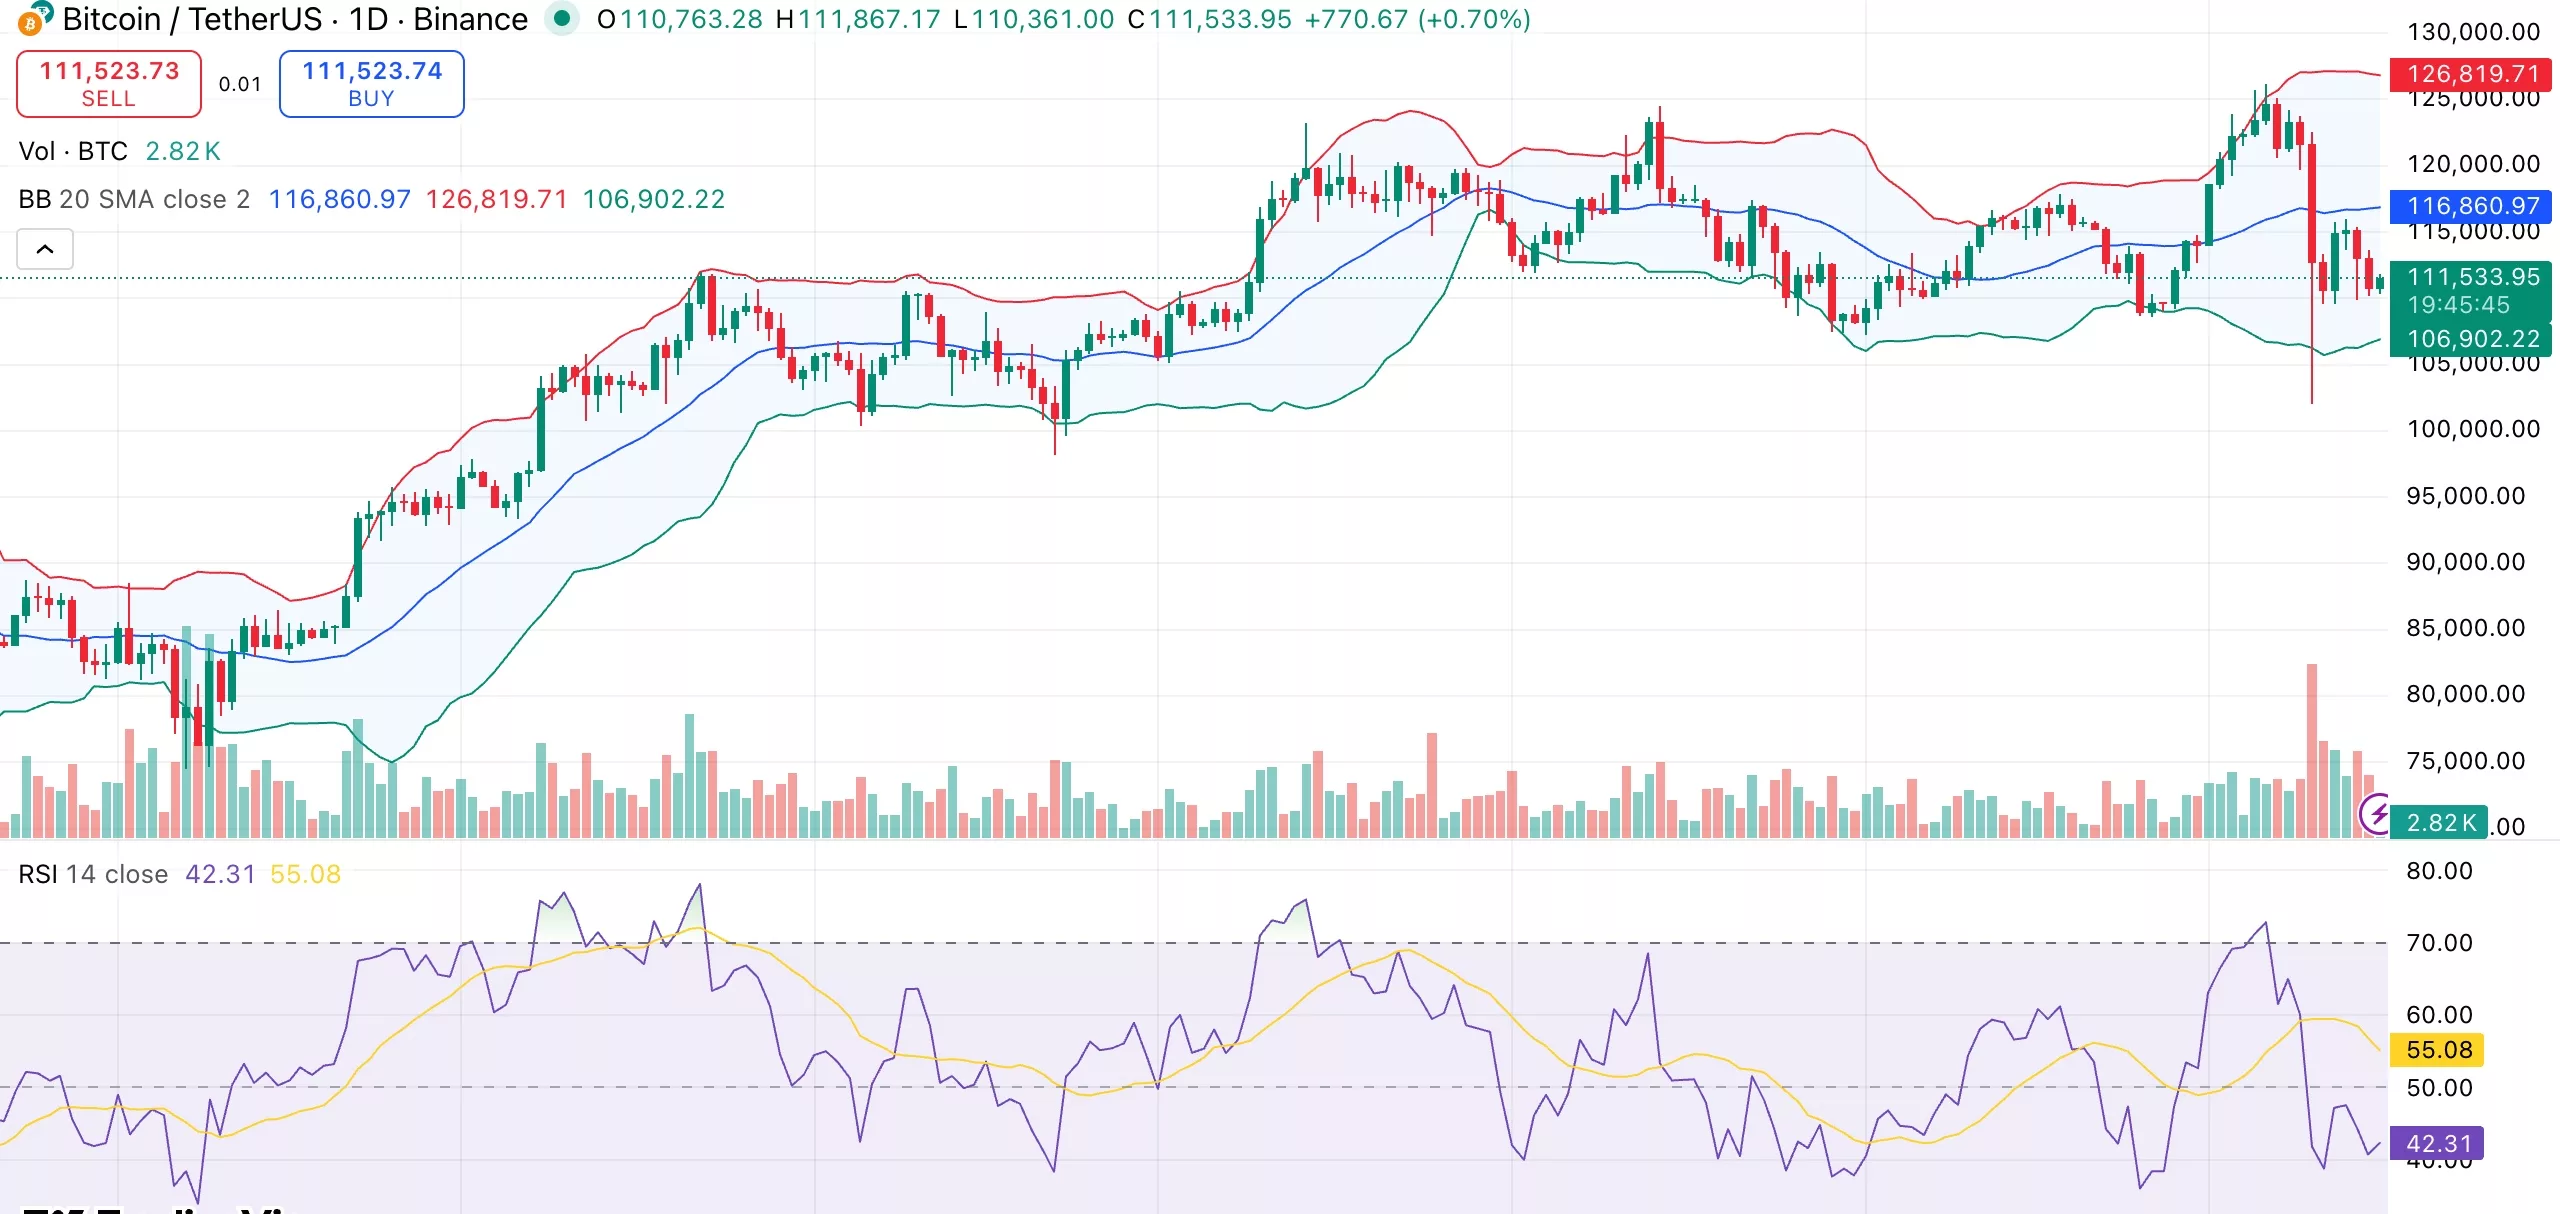
With the stochastic oscillator at 13, the market appears to have cooled rapidly and may be about to undergo a short-term reversal if buying pressure returns.
The lack of buyer follow-through following the early-October rally to $126,000 is reflected in the momentum and MACD readings, which are still negative. Still, the long-term structure is intact. The simple and exponential 200-day moving averages hover around $107,000, providing bulls with an essential safety net.
A rebound from this zone could push prices back toward resistance around $114,000–$116,000, where the mid-Bollinger Band currently sits. However, a drop below $110,000 would expose Bitcoin to a more severe decline, possibly reaching $104,000.