Bitcoin pulls back from $31,000 as a pin bar forms, upside momentum dropping


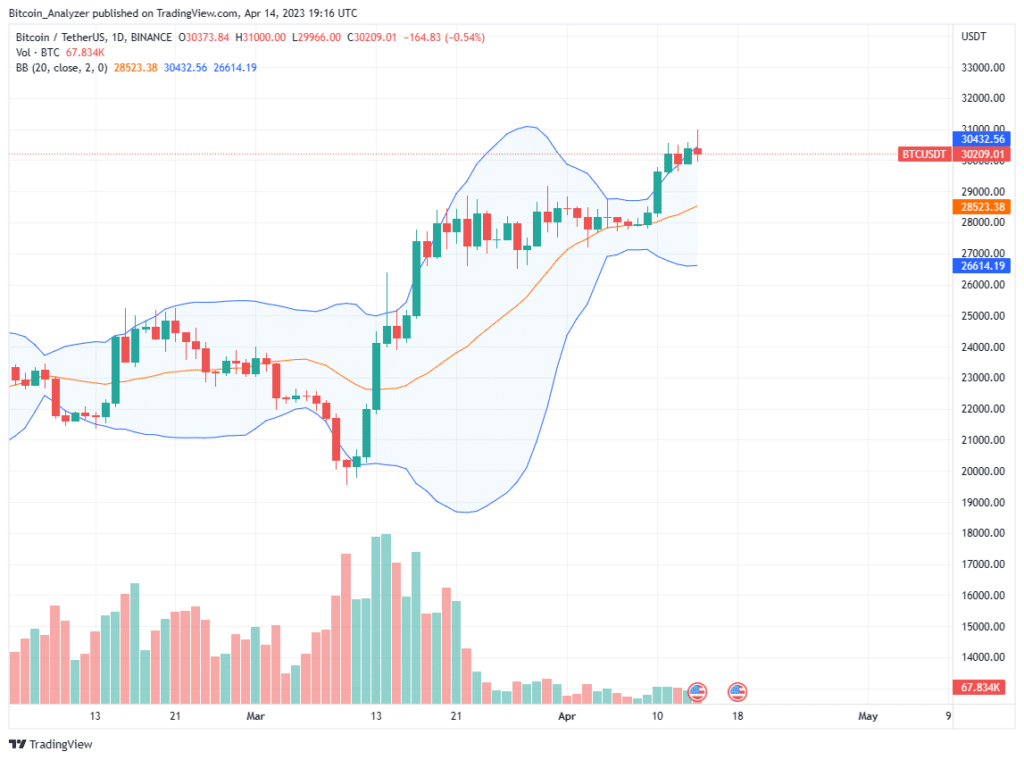
There is a pin bar on the daily bitcoin (BTC) daily chart on a day when prices soared to reach new Q2 2023 highs of $31,000.
Bitcoin pin bar forms in the daily chart
Per bitcoin’s candlestick arrangement on April 14, prices printed lower, retracing from H2 2023 highs as the uptrend lost momentum and sellers curbed the upswing, rejecting higher prices.
Subsequently, the pin bar has formed, indicating intense liquidation pressure, mainly during the New York session.
A pin bar is a candlestick with a long upper or lower bar typically formed when prices pull back from local highs or lows.
Chartists associate the pin bar with local peaks or bottoms. In the current formation, bitcoin prices are retracing from April highs of $31,000 despite traders being upbeat, expecting more gains in subsequent sessions.
Expanding from the current formation could mean bears are around the corner, and the current bull run may be coming to an end.
Despite the pin bar forming at this critical formation, it should be noted that bitcoin prices remain largely volatile and mostly firm by the close of business week 15 of 2023.
Presently, bitcoin candlesticks are still aligned along the upper BB, suggesting the uptrend momentum is strong.
Also, the divergence between the upper BB and the middle BB, that is, the 20-day moving average, points to high volatility. Moreover, general trading volumes, an indicator of participation, are low and nowhere near the activity of mid-March 2023.
U.S. economic data support the greenback
The volatility of BTC prices could be due to economic data flowing out of the United States.
On April 14, recent data shows that retail sales, an indicator of consumer spending and, thus, a guide of inflation, contracted more than expected by 1% in March, lower than the estimated -0.4%.
Even so, preliminary University of Michigan consumer sentiment revealed that surveyed consumers were confident of what lies ahead.
Typically, the more consumers are confident in their finances, the positive it is for consumer spending; a variable that can also influence inflation.
March’s U.S. consumer price index (CPI) came in weak. Inflation data from the bureau of labor statistics (BLS) showed that inflation in March contracted, much in line with economists’ expectations.
Although the U.S. index briefly fluctuated during the New York session, bulls soon took charge, pressing asset prices lower.
At the moment, the greenback continues to outperform most currencies and commodities, including bitcoin and gold prices which are likely to close lower on April 14.