Bitcoin rips all-time high, derivatives traders not as euphoric


Bitcoin rallied past its previous all-time high in the USD and USDT markets on Wednesday and extended gains on Thursday, climbing to a peak of $111,880. Bitcoin’s breakout failed to usher euphoria among traders and the reaction on derivatives traders was muted, relative to previous BTC price rallies.
Ethereum (ETH) struggles to attract institutional inflows even as ETH rallies alongside Bitcoin (BTC) in its price discovery. Altcoins in the top 50 cryptocurrencies ranked by market capitalization are in the green, rallying in the last 24 hours.
Table of Contents
Bitcoin derivatives analysis
Analysts at 10xResearch and Amberdata are in agreement on the fact that spot market strength and not speculation, is driving gains in BTC. Bitcoin’s rally beyond $111,000 failed to kick in a euphoria among traders and the long/short ratio across top derivatives exchanges is above 1. While this indicates that traders are bullish on BTC and expect further gains, on previous instances like the 2017 and 2020 cycles, the ratio exceeded 2.
The 24-hour liquidation data shows $175 million in shorts liquidations and over $47 million in long positions were liquidated. Bearish traders are being punished for betting against Bitcoin price rally, but the key question is, how high will Bitcoin go?

Bitcoin futures open interest chart on Coinglass shows a massive spike in OI. Open derivatives contracts in Bitcoin crossed a total of $78 billion in OI on May 22. OI is climbing alongside Bitcoin price, signaling strength in the BTC uptrend. Traders are confident of further gains in Bitcoin price.

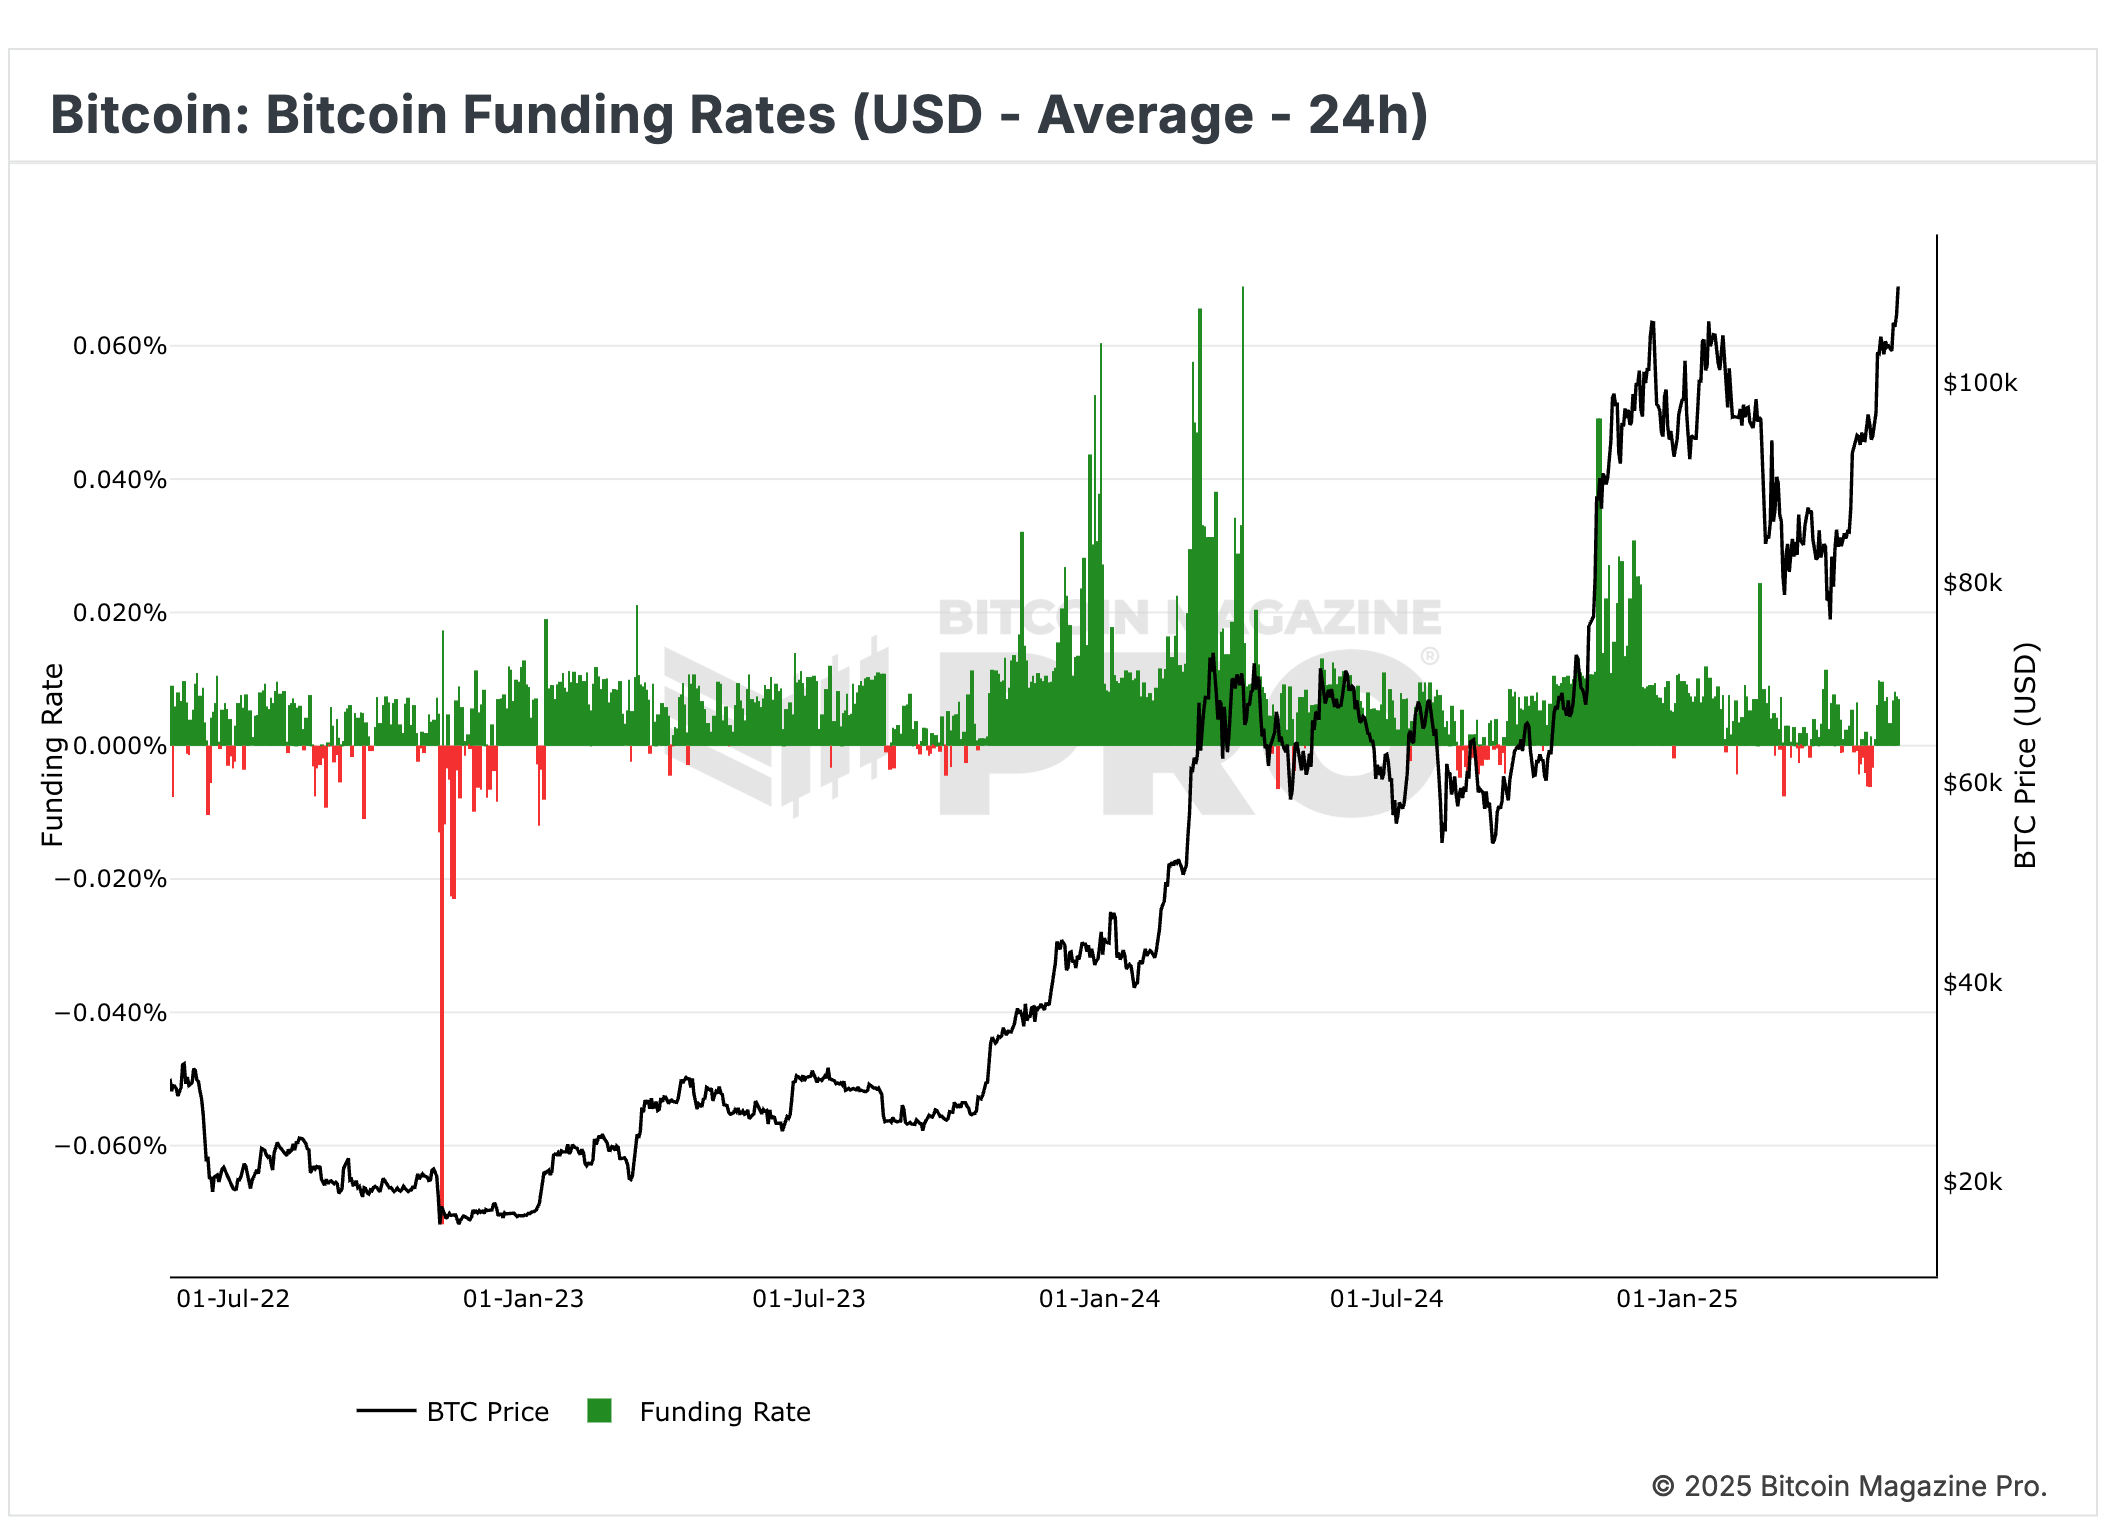
Funding rate has been positive since May 8, consistency in the green bars in the funding rate chart below shows how derivatives traders are positioning themselves for further upside in Bitcoin. A positive funding rate fuels a bullish narrative for an asset, in the case of Bitcoin this supports a thesis of gains.
Ethereum technical and derivatives analysis
Ethereum on-chain data shows a slight increase in OI, less than 7% in the last 24 hours. In the same timeframe, the long and short liquidations in Ethereum were nearly the same amount, above $60 million.
The long/short ratio across top derivatives exchanges is less than 1, even as options volume surged nearly 60%. There is no clear indication of a bullish or bearish bias among Ethereum’s derivatives traders.
Ethereum derivatives data analysis shows the largest altcoin lags behind relative to Bitcoin, in terms of interest and activity from derivatives traders.

The open interest chart on Coinglass shows, even as ETH breaks past $2,600, the OI lags levels previously seen in January and February 2025. A successful implementation of the latest technical upgrade failed to fuel a bullish sentiment among traders and catalyze gains in the altcoin.

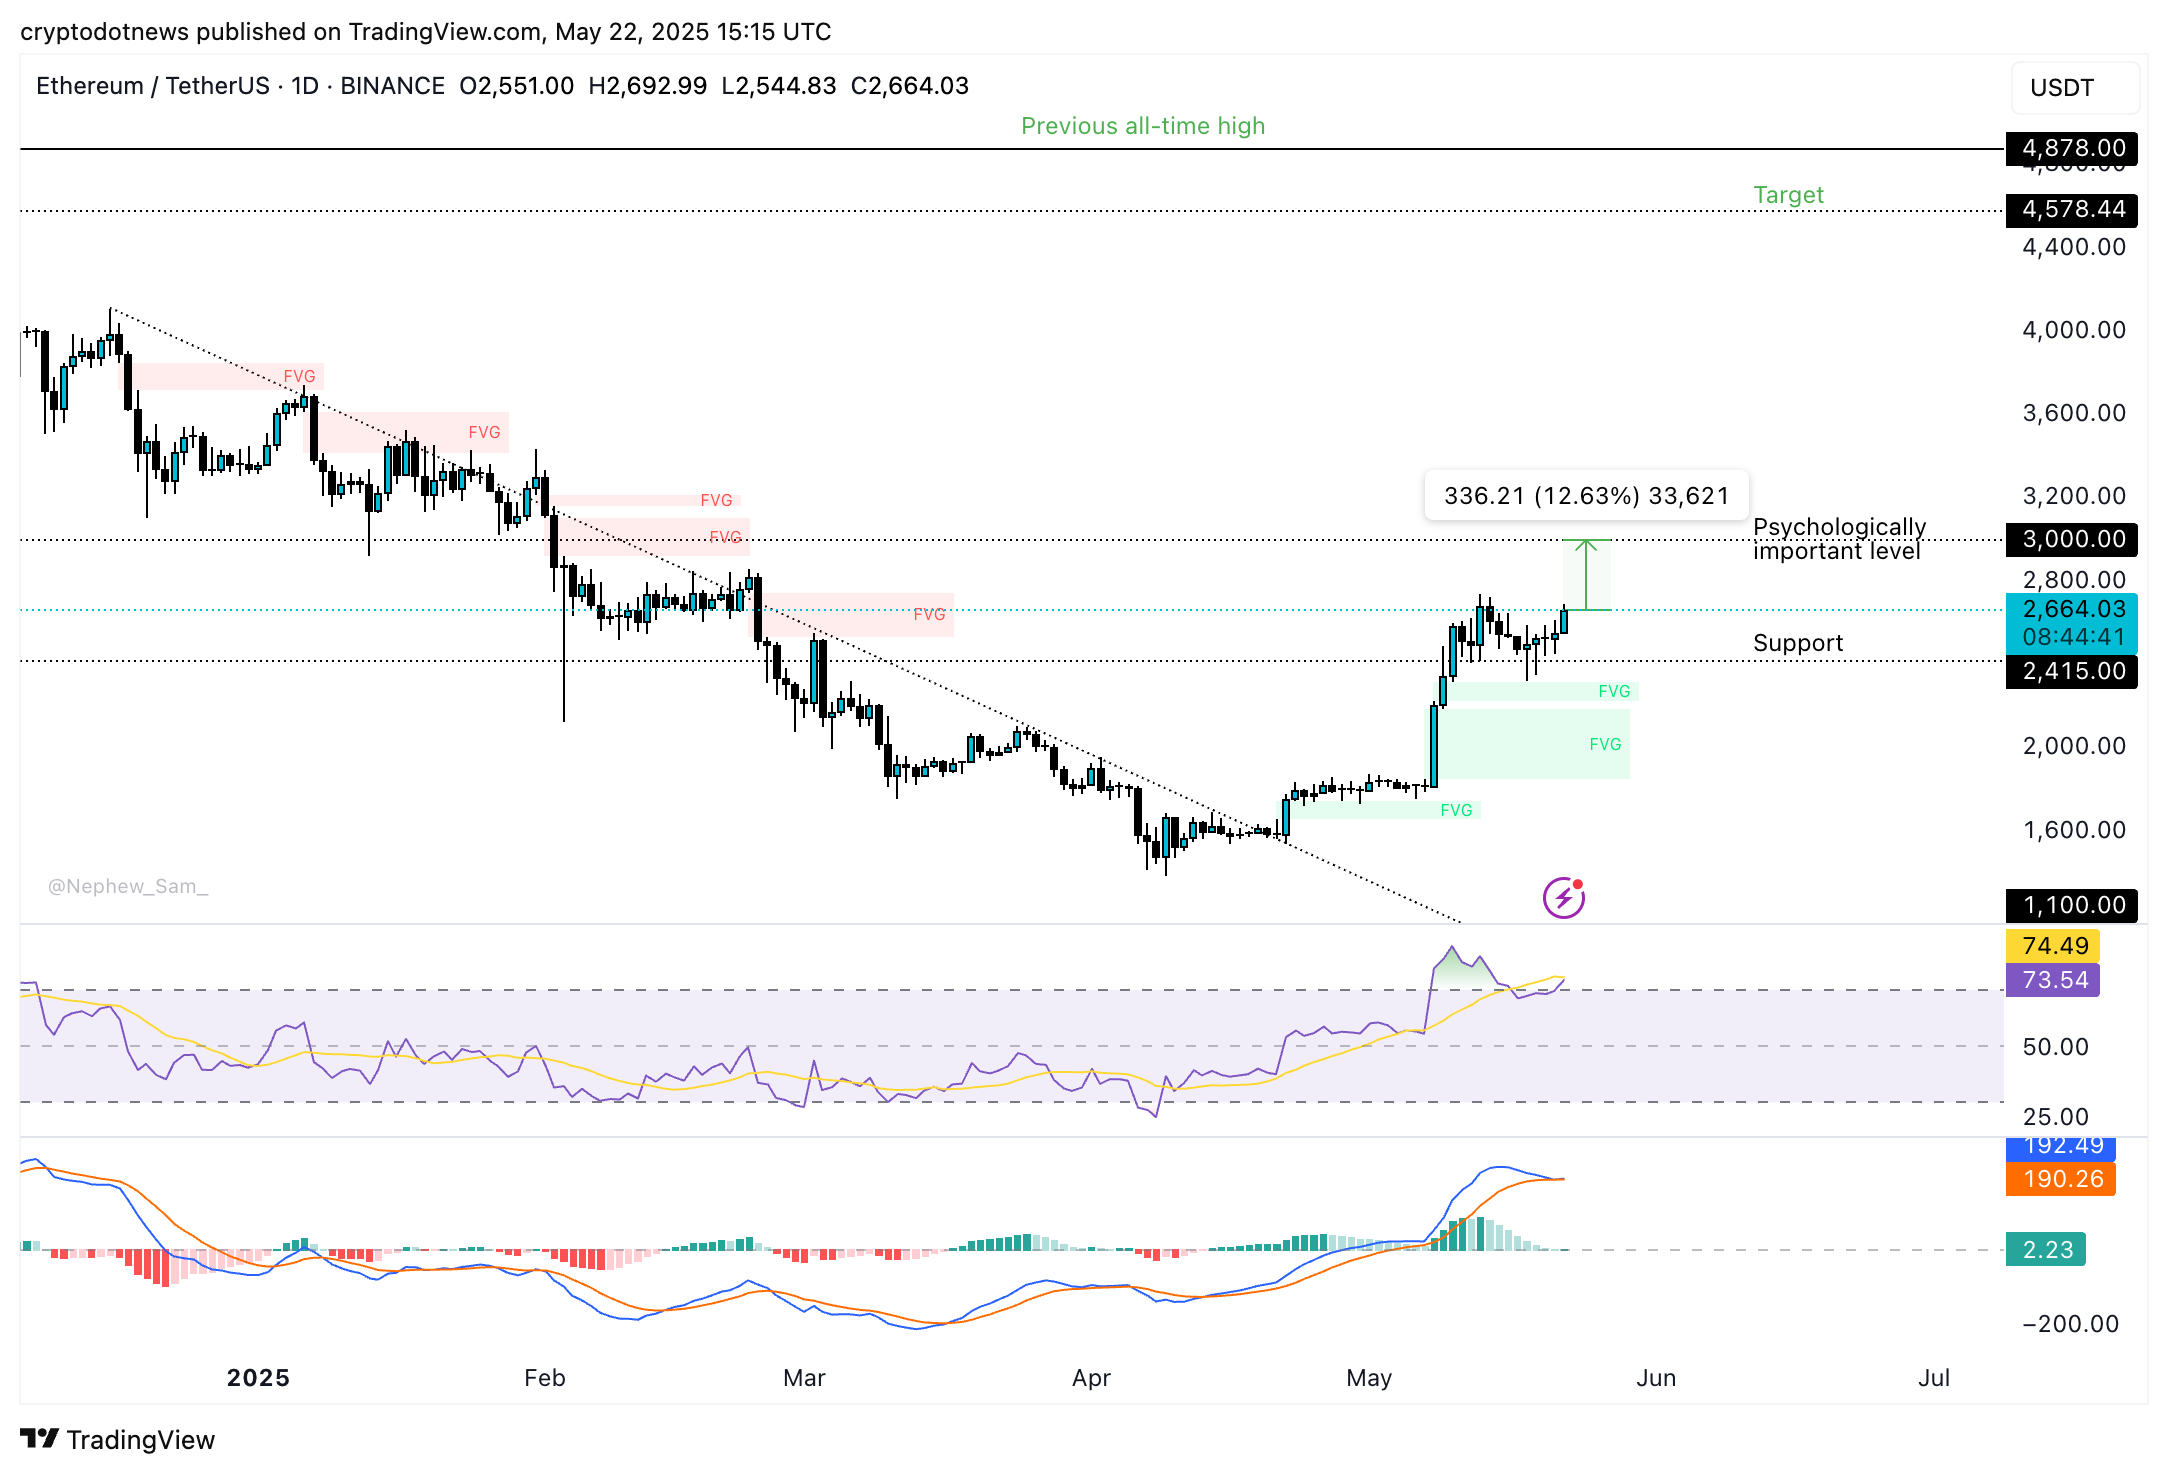
The ETH/USDT daily price chart shows ETH is currently trading 12% below its psychologically important target of $3,000. ETH has established support at $2,415, and further gains are likely as RSI slopes upwards and MACD flashes green histogram bars above the neutral line.
Ethereum’s target is the $4,578 level, as seen in the ETH/USDT price chart. The altcoin’s previous all-time high is the $4,878 level.
Crypto trader sentiment and why euphoria is missing
The Fear and Greed Index Chart on CoinMarketCap shows that even as Bitcoin enters price discovery, the levels of “Greed” observed in November 2024 were the highest. Trader sentiment is not as euphoric as one might expect, at the time of writing it reads 73.
Extreme greed is typically correlated with cycle peaks or yearly tops. Above $110,000 Bitcoin is still lagging in terms of bullish sentiment among traders.
This may be a positive sign as it supports the thesis that the cycle top is still away and traders are likely waiting and watching for the next pullback and rally in BTC.

How high can Bitcoin go?
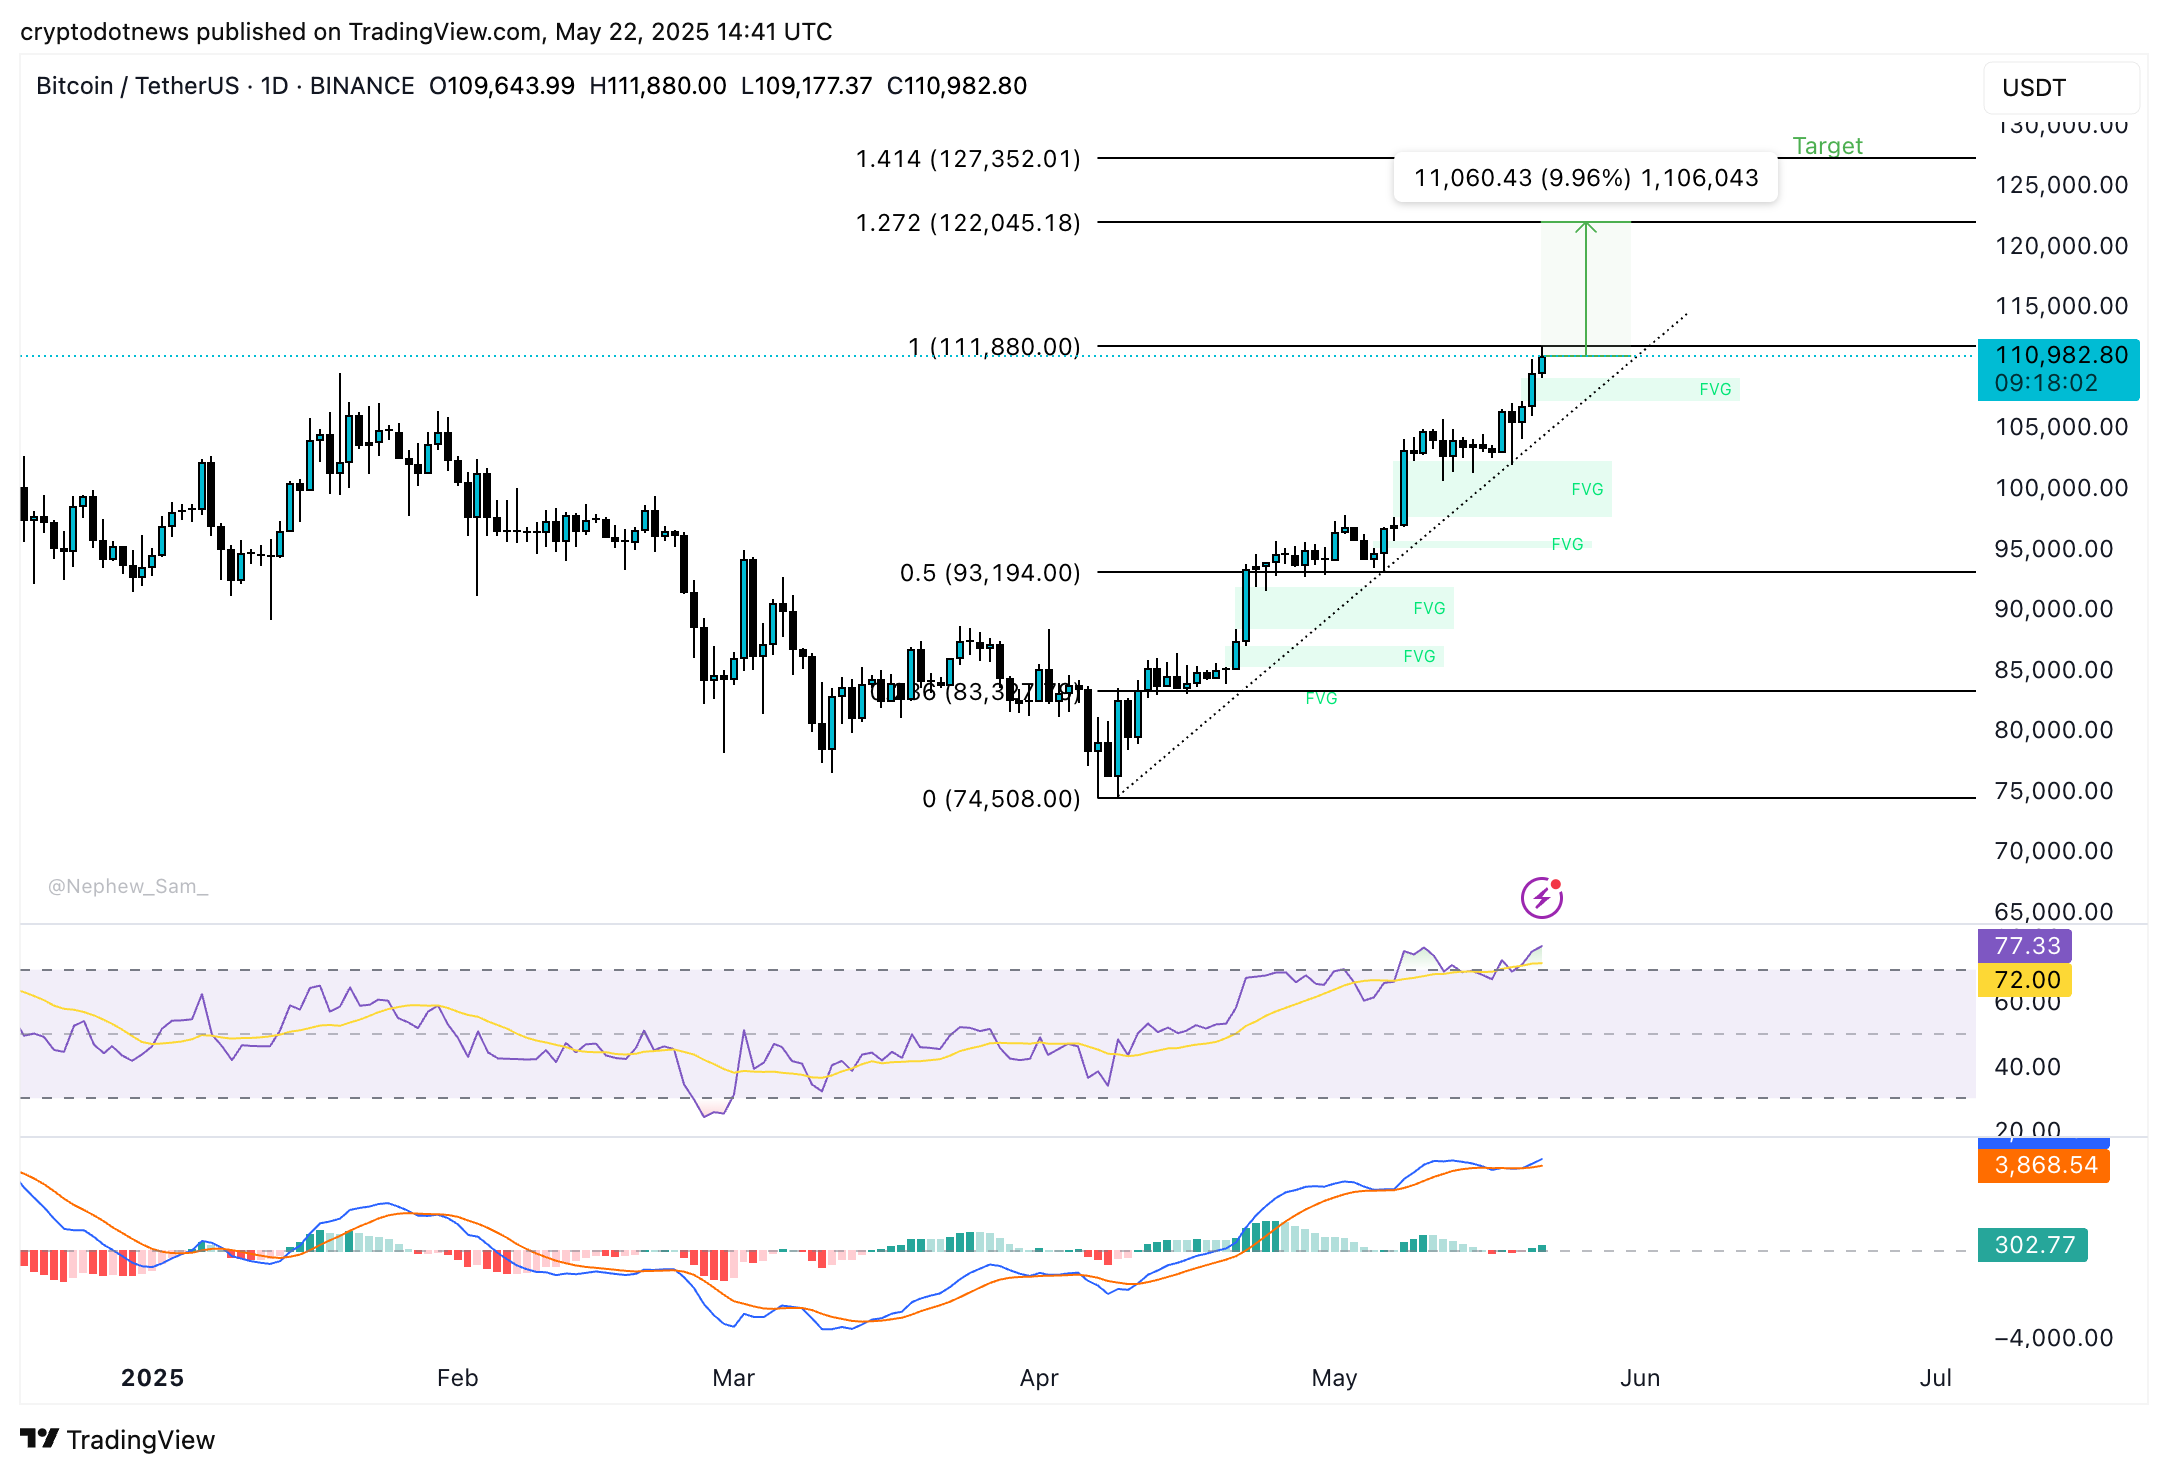
Bitcoin’s target is the $122,000 level that coincides with the 127.2% Fibonacci retracement of its 50% rally from April 7 low to May 22 peak. BTC is currently less than 10% away from its target and technical indicators on the daily price chart support likelihood of further gains.
RSI is sloping upwards and crossed into the “overvalued” zone and MACD flashes consecutive green histogram bars. If Bitcoin tests resistance at $122,000 and breaks past this level, the next target at $127,352 comes into play.
The $127,352 target is the 141.4% Fibonacci retracement level for Bitcoin in its ongoing upward trend. While analysts at Bernstein pushed their target for Bitcoin to $200,000 in 2025, it is likely that BTC crosses the $127,000 level before June 2025, based on its gains since April 2025.
Expert commentary
Shubh Varma, the CEO of Hyblock Capital told Crypto.news that from a technical perspective, he sees the most reliable support zone between $101,000 and $102,500. Exchanges like Binance and Bybit have seen “heavy open interest entries that trap shorts and attract fresh longs,” in this zone.
Bitcoin pushed above resistance between the $105,000 and $106,000 level early on Thursday. It remains to be seen how long Bitcoin holds above the FVGs on the daily timeframe.
Bitfinex analysts told Crypto.news in a written note that the team is watching minor liquidity walls between $114,000 and $118,000 and the $123,000 to $125,000 zone is where large options open interest is building. These are key areas of interest for traders to watch in the coming weeks of May 2025.
Disclosure: This article does not represent investment advice. The content and materials featured on this page are for educational purposes only.