Bitcoin’s September slump is back, raising the question of a Q4 recovery


Bitcoin faces its weakest month, but history shows Q4 often brings recovery. The question is whether September’s drag will again set the stage.
- September is historically Bitcoin’s weakest month, but Q4 has often reversed losses, with October and November delivering some of the strongest rallies on record.
- Bitcoin trades near $111,000 after a 10% pullback, while Ethereum consolidates around $4,350. Institutional inflows above $55B and stablecoin reserves near $300B support sentiment.
- The Fed is expected to cut rates in September, inflation hovers near 2.6–2.7%, and the dollar’s 11% slide boosts global risk appetite.
- Tariffs on imports and semiconductors raise costs for miners and manufacturers, complicating inflation control and adding pressure on global supply chains feeding into crypto markets.
- SEC and CFTC guidance could allow spot crypto trading on U.S. exchanges. Combined with PlanB’s model, liquidity growth supports long-term adoption, but risks remain.
Table of Contents
History shows September as Bitcoin’s weakest month
Markets often move in patterns, and crypto has shown a seasonal rhythm that resembles what has long been observed in equities. This rhythm is especially visible when looking at how certain months tend to behave year after year.
According to CoinGlass data, average returns in August hover around 1%, while median performance trends closer to a 7% loss.
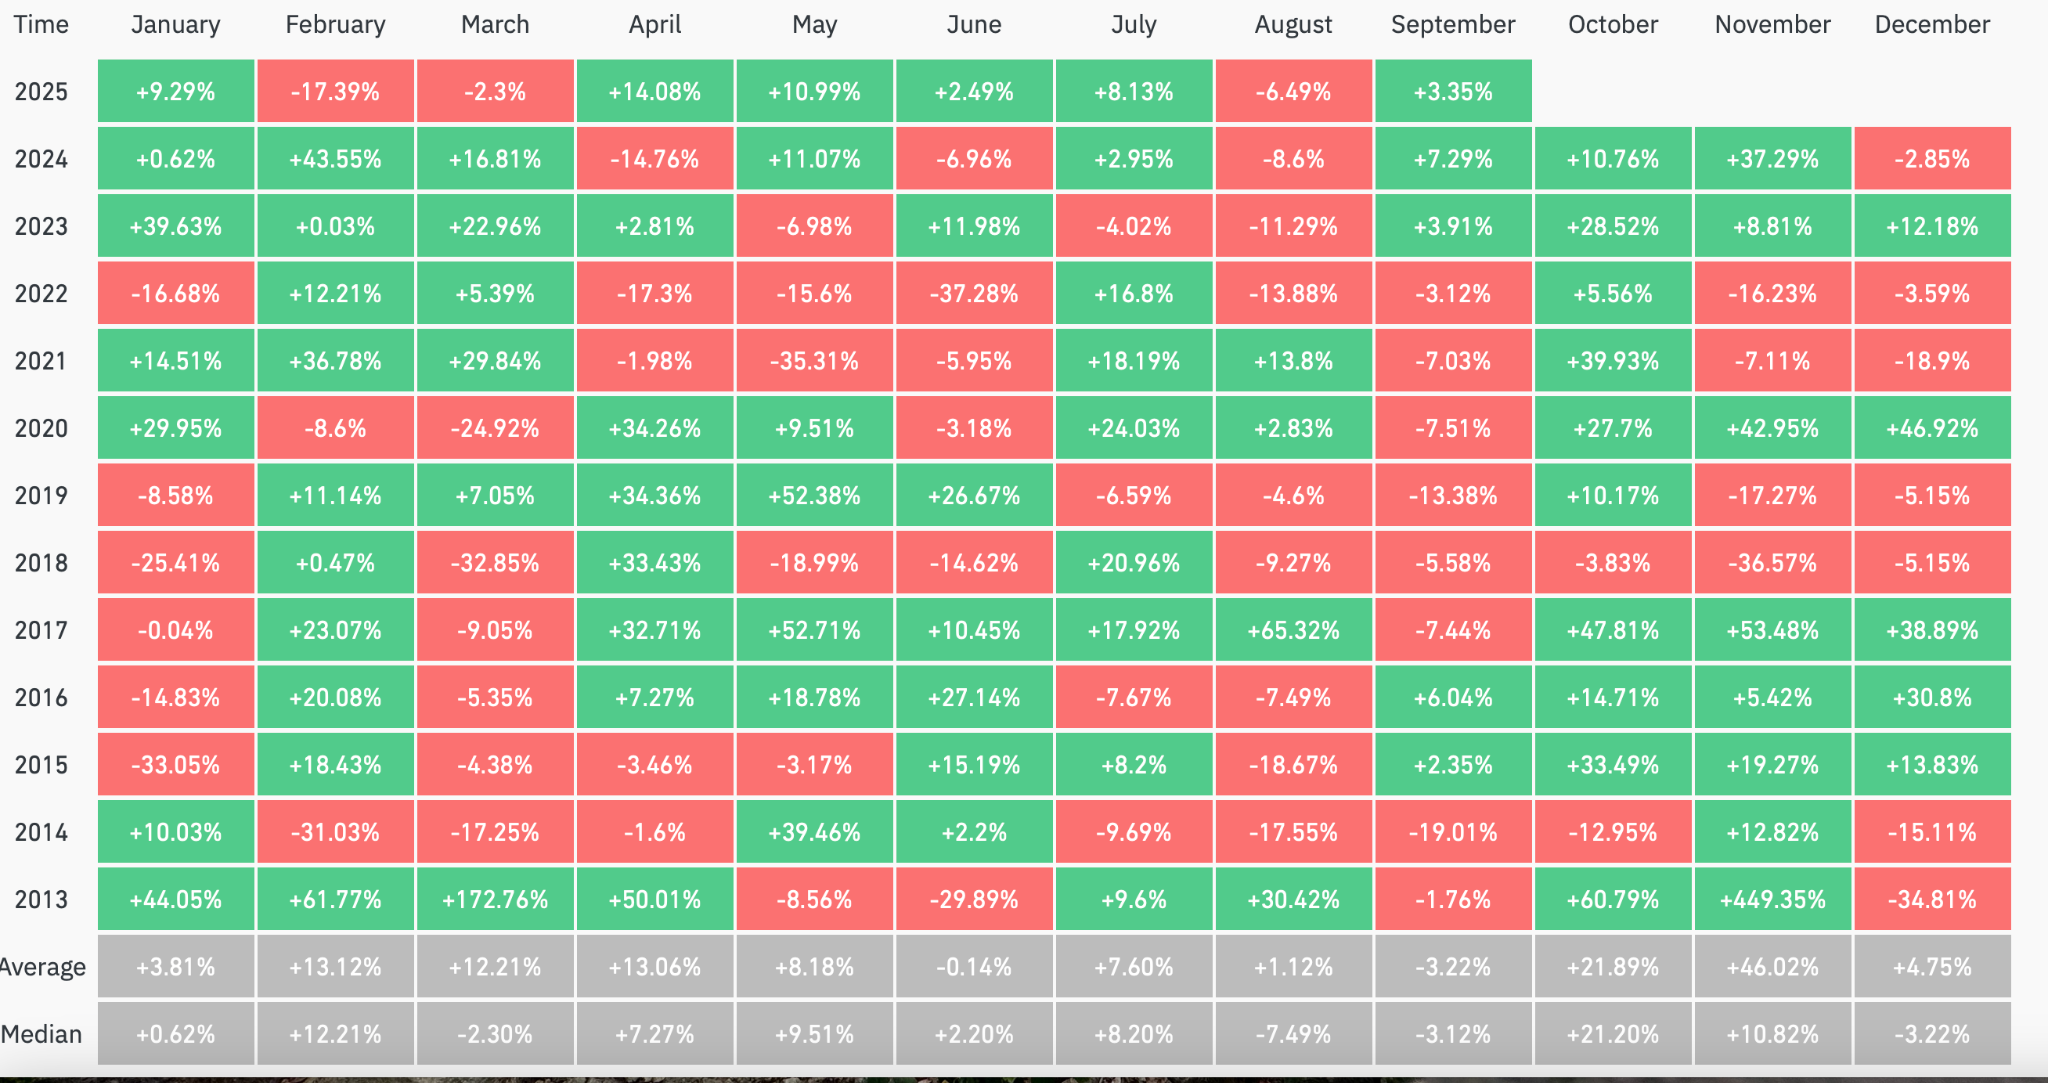
Sharp setbacks in August include a decline of more than 19% in 2015 and nearly 14% in 2022. Even in bullish periods, such as 2020, Bitcoin (BTC) added less than 3%, pointing to how August often cools momentum rather than extends it.
Meanwhile, September has been even more challenging. It is the only month where both average and median returns for Bitcoin sit in negative territory at about 3%. Nine of the past thirteen Septembers have closed with losses, including roughly 13% in 2019 and 7% in 2021.
The broader stock market has long followed a similar path. Since 1950, the S&P 500 has averaged a decline of about 0.7% in September, with gains in only 44% of years. The last decade has been weaker still, with average losses near 2%.
Some possible explanations include portfolio rebalancing after the summer, liquidity tightening as capital moves back into traditional markets, and tax-related adjustments by U.S. entities.
Crypto’s September weakness may reflect an overlap of these forces with its own leveraged trading environment.
However, the contrast arrives in the final quarter. October has historically produced average gains of around 22% and November close to 46%, making them the strongest months for crypto.
In 2017, Bitcoin climbed nearly 48% in October and more than 53% in November, fueling the rally toward $20,000. In 2020, the same stretch delivered gains of almost 28% and 43%, pushing Bitcoin beyond its old highs.
What stands out is that while August unsettles and September brings losses, the final quarter has typically revived market sentiment. The question is whether this pattern can hold in Q4 2025.
Consolidation signals a pause
As of Sep. 3, BTC trades close to $111,000 after pulling back from its mid-August high above $124,000. The correction of around 10% has brought the asset back to test support in the $108,000 to $109,000 zone.
Spot BTC ETF flows have remained steady, with net inflows of roughly $750 million since Aug. 25, showing that institutional demand has held firm despite the overall selling pressure.
Overall, Bitcoin ETFs have absorbed more than $55 billion in inflows since their launch, and public companies now hold close to 6% of the supply.
Amid this, Ethereum (ETH) has entered a phase of consolidation. After reaching $4,955 in late August, ETH has eased into the $4,450 levels, a decline of nearly 10%.
Institutional flows into Ethereum products remain steady, with nearly $950 million in net inflows since Aug. 25. In parallel, activity across layer 2 networks is expanding, showing that Ethereum’s role in the market continues to strengthen.
Stablecoin reserves have also grown to nearly $300 billion, expanding market liquidity and providing dry powder for future allocations.
Speculation is swirling, and comparisons are being made to 2017, when a weak summer gave way to a strong Q4 rally under similar conditions, hinting at a better September than in previous years.
Macro easing and trade tensions pull crypto in opposite directions
Global financial markets head into September with monetary policy taking center stage. Futures markets are pricing in more than a 90% chance that the Federal Reserve will deliver a 25 basis point rate cut at its meeting on September 17.
Recent inflation readings reinforce that expectation. The PCE price index is rising at 2.6% year on year, core CPI is hovering around 2.7%, and the Dallas Fed trimmed-mean stands at 2.65%, all within range of the Fed’s 2% target, creating room for potential easing.
Investor sentiment appears to be aligning with that view. Gold is trading above its record high of $3,600, reflecting a shift toward alternative assets as markets prepare for looser policy conditions.
In parallel, the U.S. dollar has weakened sharply. According to Morgan Stanley’s report, the DXY index has dropped by roughly 11% in the first half of 2025, marking one of its steepest annual declines in over five decades.
A softer dollar typically enhances global purchasing power and has historically coincided with stronger inflows into risk assets, including crypto assets.
Bond yields remain another key indicator of financial conditions. The 10-year Treasury yield is holding in the mid-4% range, while the 30-year yield is hovering near 5%.
Despite the growing likelihood of short-term rate cuts, elevated yields at the long end of the curve continue to tighten liquidity, raising the stakes for upcoming labor and inflation data releases.
However, trade tensions remain a major overhang. The U.S. has imposed a baseline 10% tariff on imports, with additional duties targeting strategic sectors such as semiconductors and metals.
Although some of these measures face legal challenges, they are expected to stay in place through at least October.
The impact is already visible. U.S. manufacturing activity has contracted for six consecutive months, signaling stress across the industrial economy.
Rising input costs are pushing up inflation expectations, complicating the Fed’s decision-making while disrupting global supply chains.
For crypto, the effects are nuanced. Tariffs on chipmaking tools and a proposed 100% duty on certain semiconductors directly raise costs for tech hardware, including ASICs and GPUs. That, in turn, squeezes mining margins and could slow hash rate expansion.
All of this feeds into the broader outlook for digital assets. A weaker dollar and lower interest rates historically support crypto markets, but rising production and import costs present a new set of challenges.
The question this month is whether supportive macroeconomic conditions can outweigh the tariff-driven headwinds weighing on risk appetite.
What to expect next?
Regulators are laying the groundwork for crypto to move closer to mainstream financial markets. A joint statement from the SEC and CFTC on Sep. 2 confirmed that existing law does not prevent registered U.S. exchanges from listing certain spot crypto products.
The agencies also announced plans to coordinate under their “Crypto-Crypto Sprint” initiative to issue guidance on leveraged and margin transactions, with the stated goal of enhancing regulatory clarity and broadening investor access.
Such a shift could carry major implications. Listing on national exchanges would deepen liquidity, tighten bid-ask spreads, and attract a wider base of institutional and retail participants.
Investors already using ETFs would gain an additional regulated pathway, while everyday traders could engage with crypto through platforms they already trust.
Improved liquidity often leads to more efficient price discovery, though it can also amplify market swings during periods of heavy positioning. The benefits and risks are likely to grow in parallel.
Amid these developments, PlanB’s latest update places Bitcoin’s 200-week moving average and realized cost near $52,000. His stock-to-flow model estimates an average price of almost $500,000 across the 2024 to 2028 halving cycle.
If increased liquidity on U.S. exchanges coincides with tightening supply dynamics, the case for Bitcoin’s evolution into a more mature and investable asset could continue to strengthen.
Still, models are only one part of the picture. Regulatory timelines often move slowly, and markets rarely follow projections with precision. Investors should approach this with caution and never invest more than they can afford to lose.
Disclosure: This article does not represent investment advice. The content and materials featured on this page are for educational purposes only.