Bitcoin stalls, but chart watchers eye $300,000 peak: Here’s when


Bitcoin price has stalled below $105,000, but a popular model points to a surge to between $275,000 and $300,000 by October this year.
Bitcoin (BTC) was trading at $103,400 at press time, a few points below this month’s high of $105,900.
The Bitcoin Spiral Clock is a popular model that looks at Bitcoin price cycles around halving events. Halving is a process where Bitcoin’s rewards are slashed by half in a bid to control the supply of new coins entering circulation. It happens after every 210,000 blocks are mined, which happens after four years.
The spiral clock shows the historical price peaks and crashes. As shown below, Bitcoin stands at block 896,988, meaning that it is about 3:15 on the clock. The clock then predicts that Bitcoin will peak between $270,000 and $300,000 by October this year. The higher side of the prediction implies a 191% surge from the current level.
Bitcoin has some bullish catalysts in the coming months. First, Moody’s became the third major ratings agency to slash US credit rating, citing its soaring debt and fiscal mismanagement.
A credit rating is seen as bullish for Bitcoin because it has emerged as a safe-haven asset. For example, Bitcoin outperformed stocks and other assets after Donald Trump launched his tariffs in April. Also, unlike the US dollar, Bitcoin has a fixed supply, making it less inflationary.
Second, Bitcoin demand continues rising, with spot BTC ETFs nearing the $42 billion inflow milestone. The iShares Bitcoin ETF has accumulated over $65 billion in assets and is nearing the SPDR Gold Trust, which has over $90 billion.
Bitcoin demand also comes from institutions, with Michael Saylor’s Strategy having 568,840 coins in its balance sheet. Other firms like Next Technology, Bitfarms, and Semler Scientific have also boosted their holdings.
Conversely, the supply of Bitcoin in exchanges and over-the-counter markets has continued to fall. Therefore, the confluence of falling supply and rising demand means that Bitcoin will likely keep rising.
Top analysts are also highly bullish on Bitcoin, with BlackRock aiming for $700,000 and Standard Chartered predicting that it will hit $200,000 by the end of the year.
Bitcoin price technical analysis
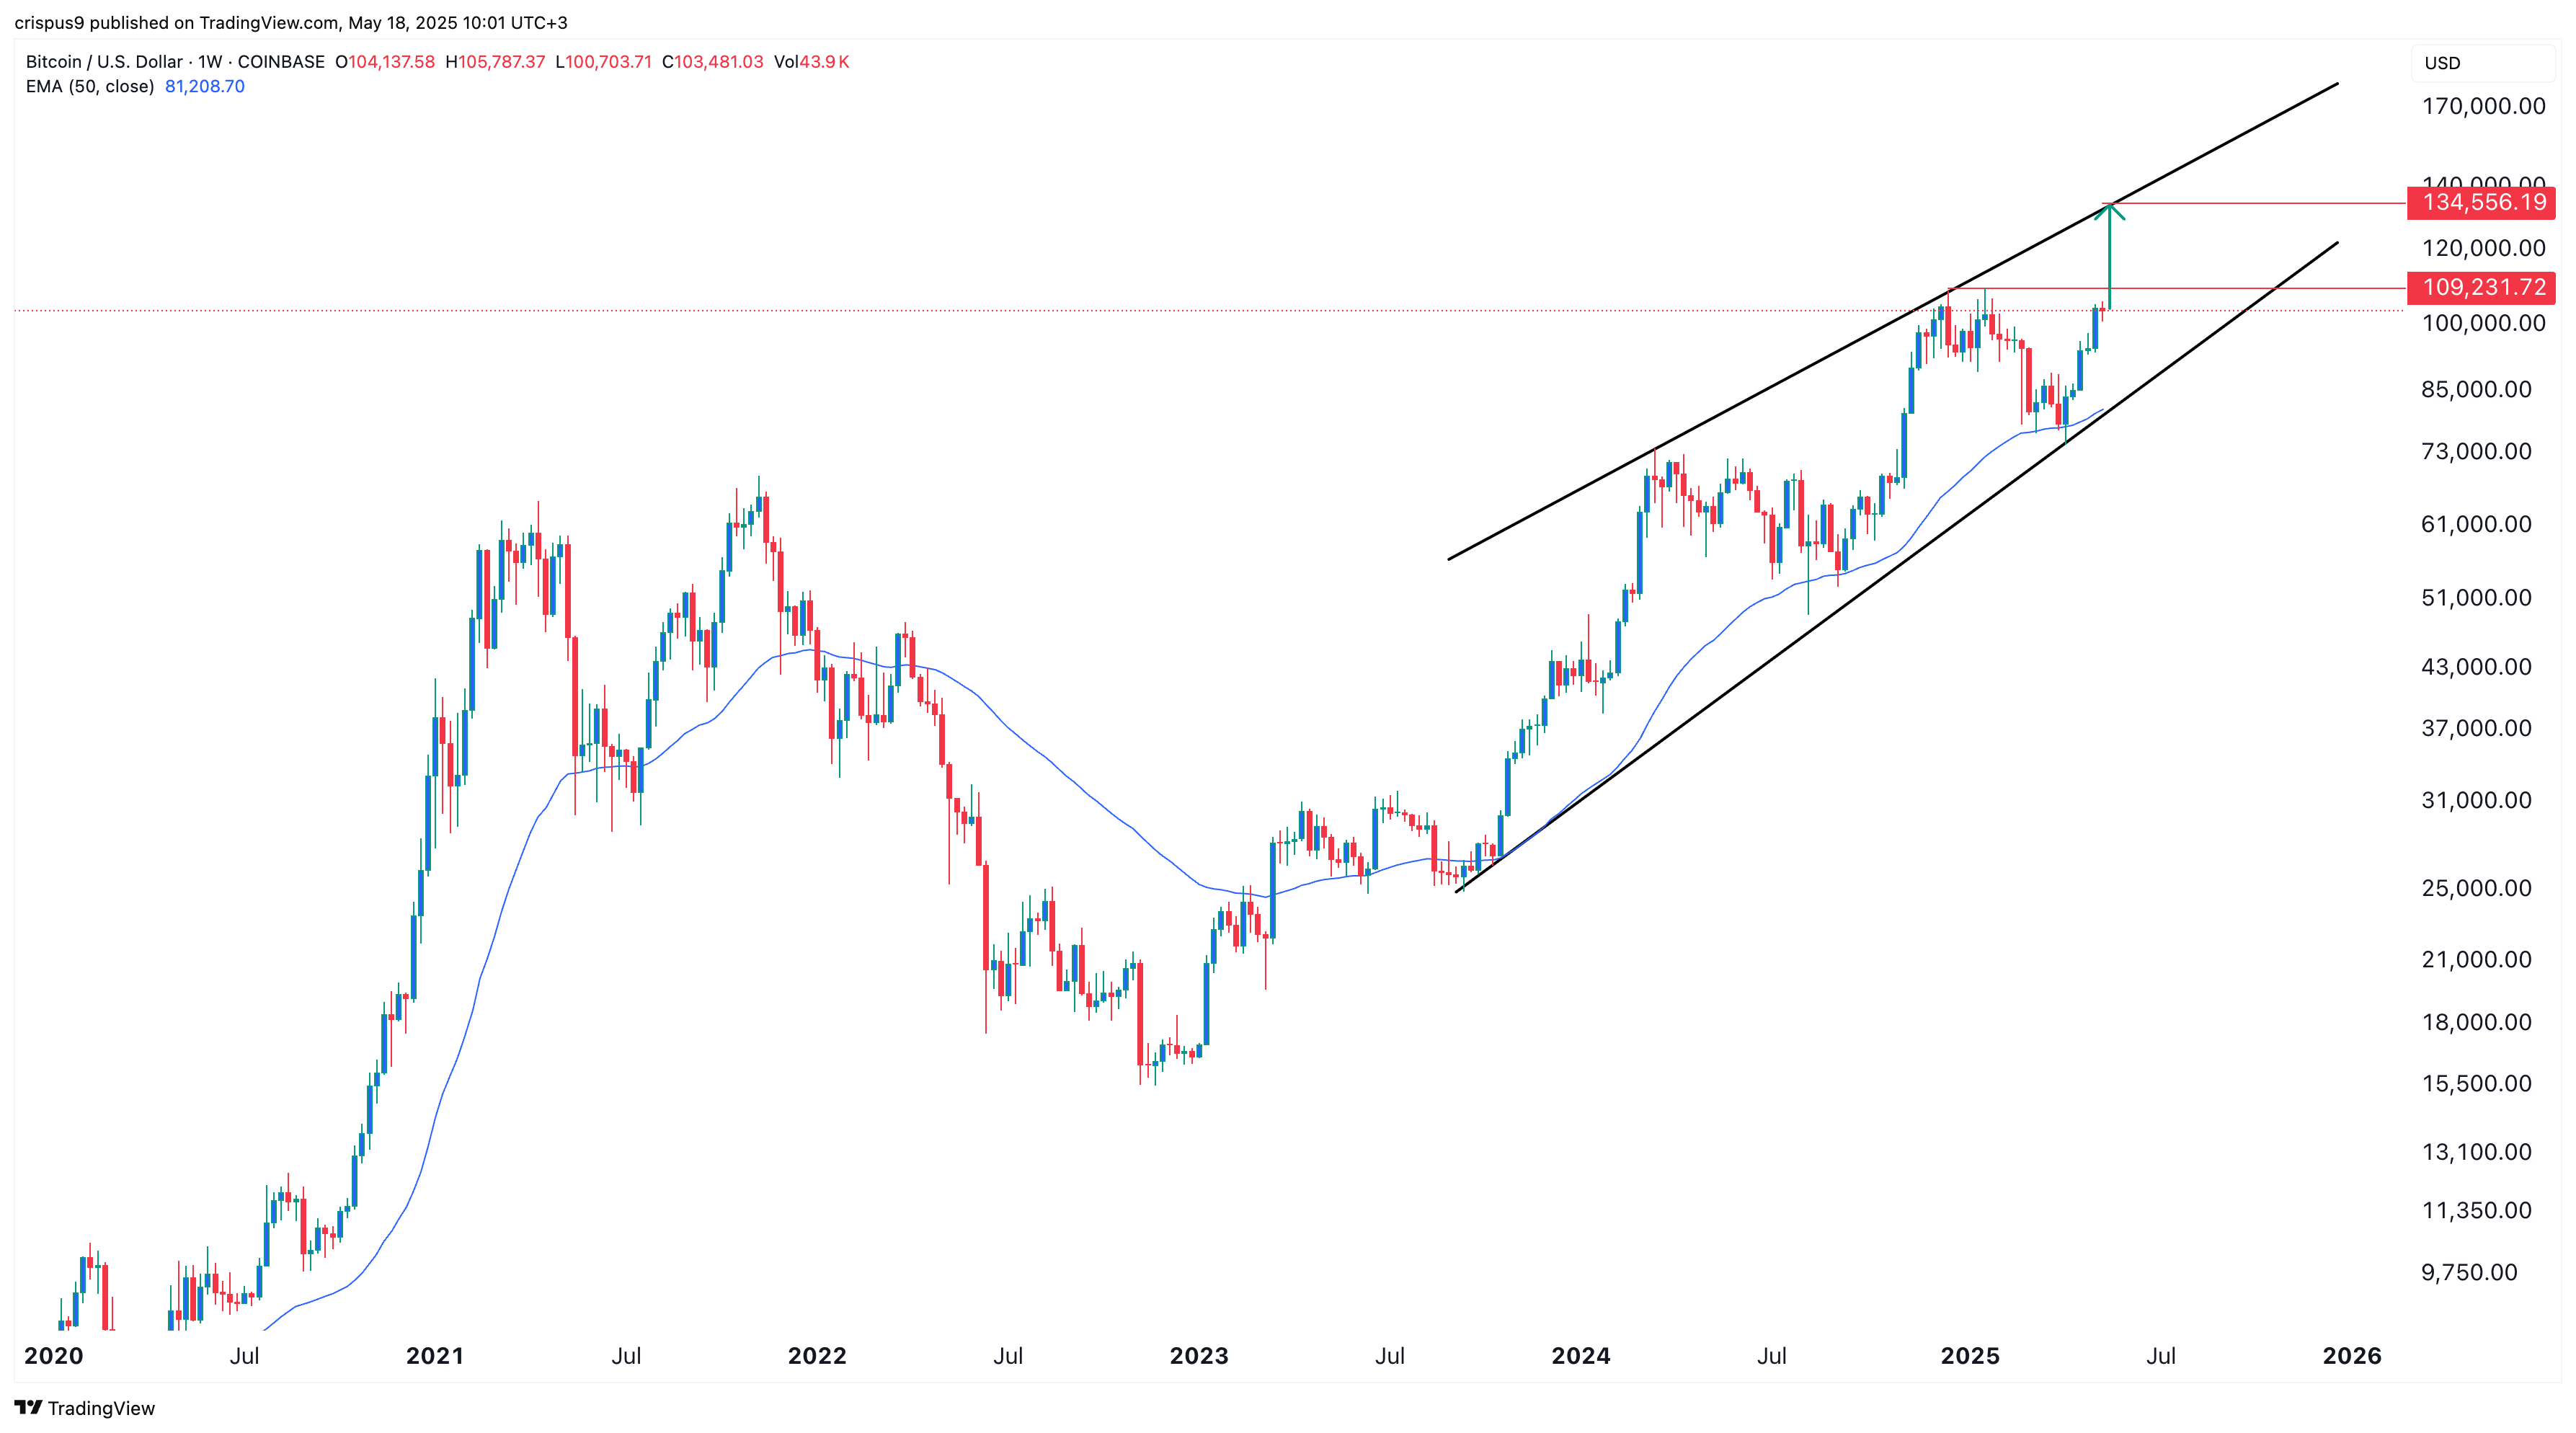
The weekly chart shows that Bitcoin’s price has been in a strong uptrend in the past few months and is now nearing the key resistance level at $109,230, its all-time high.
Since October 2023, the 50-week Exponential Moving Average has supported Bitcoin, which has also formed an ascending channel.
Therefore, more gains will be confirmed if it moves above $109,230, as doing that will invalidate the double-top pattern whose neckline is at the 50-week moving average at $81,210. Such a move will point to more gains, potentially to the upper side of the channel at $134,556.