BNB price breaks key support, is $1,000 next on the way down?


After a short-lived rebound, BNB price has slipped back under the key $1,100 level, erasing its recent gains as sellers regained control of the market.
- BNB price has dropped to $1,069, falling over 5% in 24 hours and 13% on the week, mirroring the broader crypto market downturn.
- Market sentiment is shaky, with trade tensions and macro uncertainty weighing heavily on investor confidence.
- Technical indicators like the RSI and MACD flash bearish signals, pointing to more downside.
- With $1,100 breached, BNB price eyes support at $1,020 and the psychological $1,000 mark; failure to hold could open the door to a deeper correction.
BNB price is currently hovering around $1,069, posting losses of 5% and 13% on the daily and weekly timeframe, according to market data from crypto.news. The 4th-largest cryptocurrency’s performance mirrors the downtrend in the overall market, exacerbated by ongoing macroeconomic uncertainties and trade wars.
The Binance coin has been trading within a descending channel since early October, marked by consistent lower highs and lower lows. BNB (BNB) price attempted several rebounds toward the upper trendline near $1,180 but failed to sustain momentum, confirming continued selling pressure.
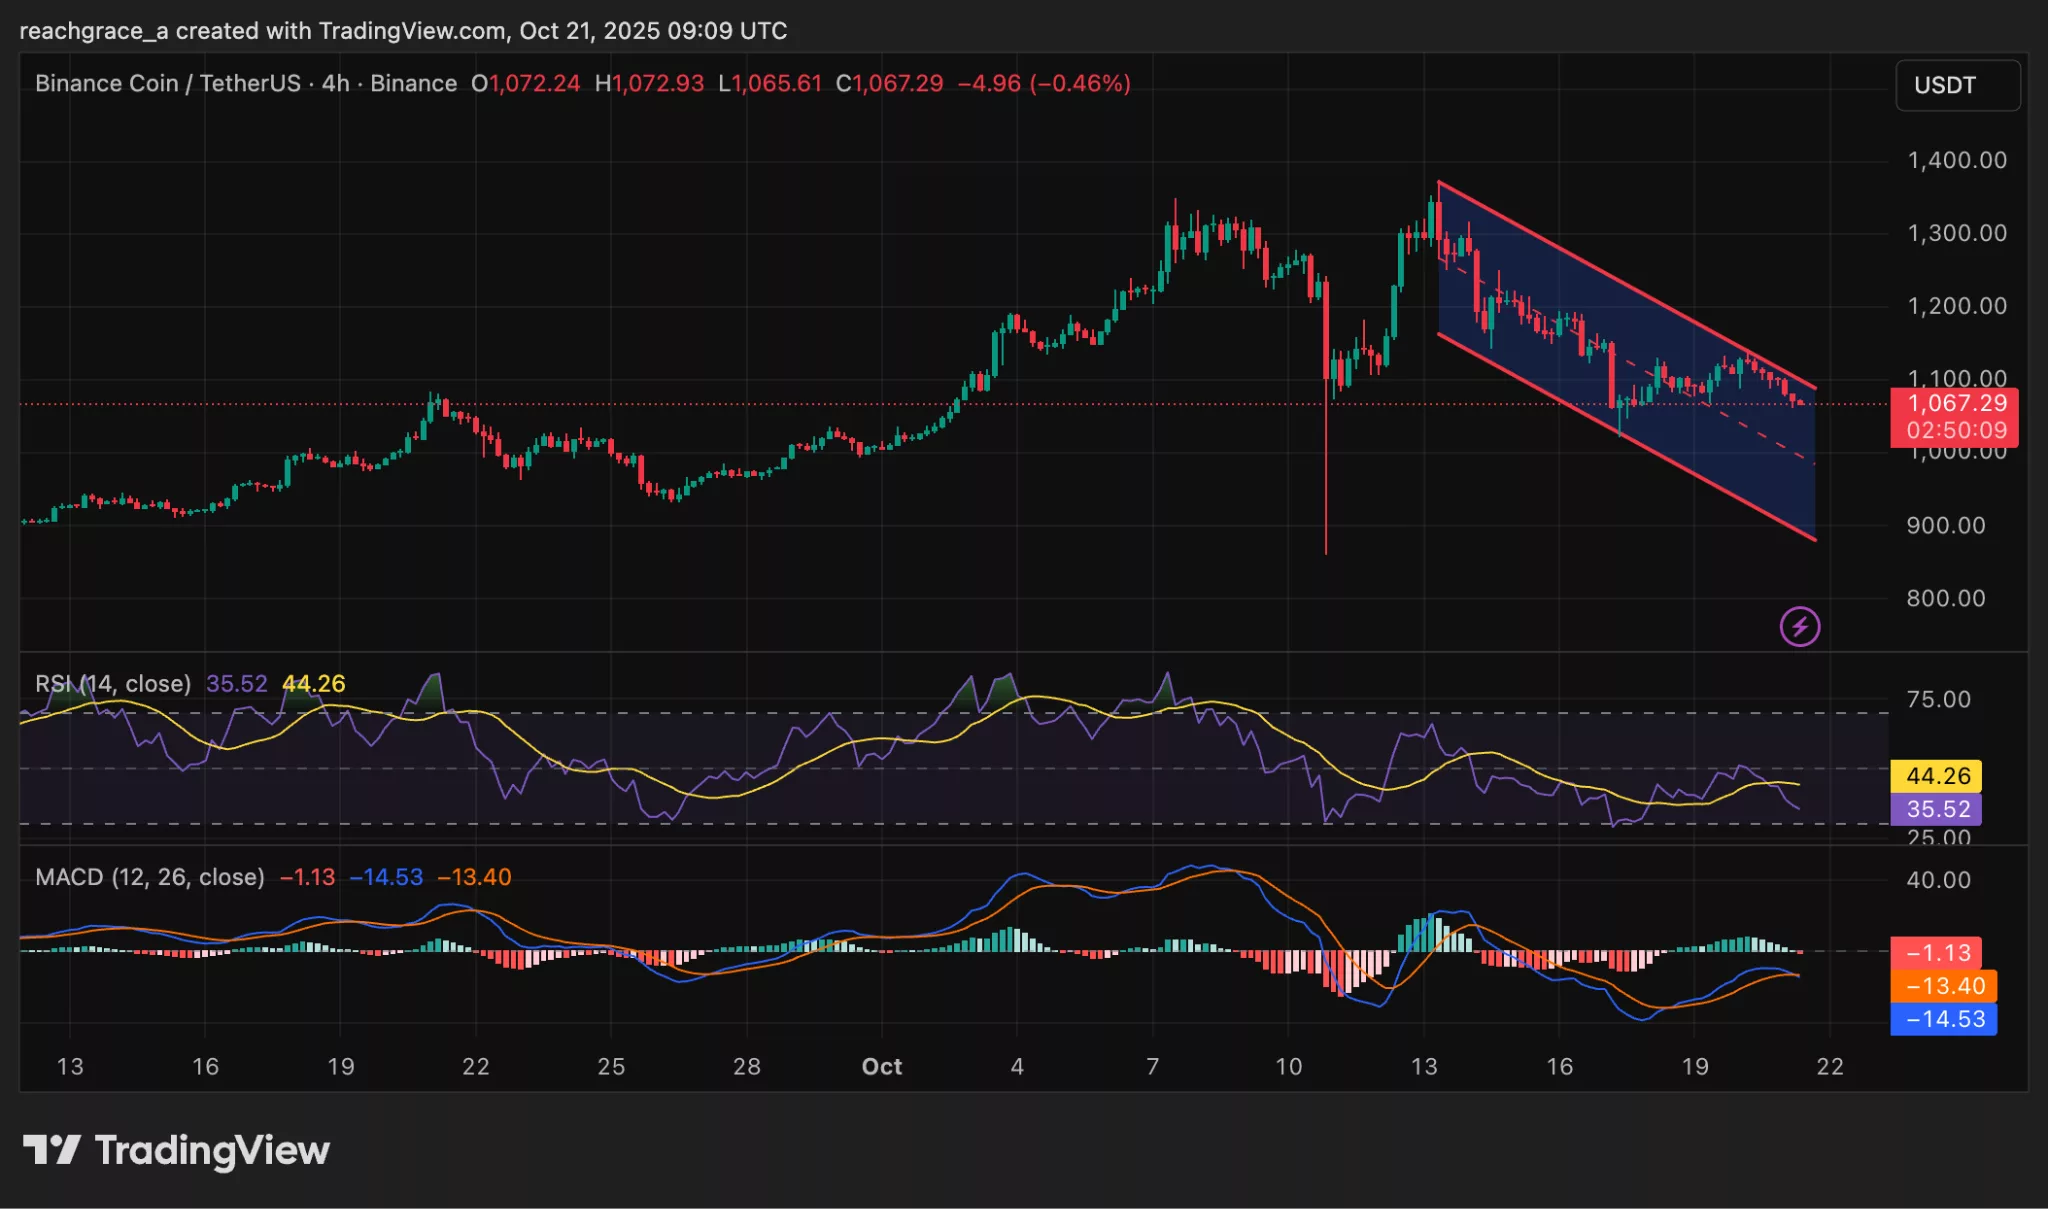
Price action opened the week above $1,200, but quickly succumbed to selling pressure, dragging the token closer to the $1,050 support zone by October 21. The recent drop below $1,100 has now brought BNB closer to the channel’s lower boundary, which currently aligns around the $1,050–$1,030 zone.
This area is acting as the last visible support before the psychological $1,000 mark, a level that could become a key battleground between buyers and sellers.
BNB price eyes $1,000 correction as technical indicators support downtrend
From a momentum standpoint, the chart shows the token’s Relative Strength Index (RSI) has declined to 35.60, moving further below its 14-day moving average at 44.26. The widening gap confirms that sellers are in control, with momentum skewed to the downside. The RSI remains below the neutral 50 level, and unless it flattens or reverses, it supports further weakening in the short term.
The MACD indicator reinforces this bearish outlook. The MACD line at –14.50 sits just below the signal line at –13.39, with the histogram still negative at –1.11, suggesting mild but sustained bearish momentum.
With $1,100 now broken, the next support levels lie at $1,020 and $1,000. A decisive move below $1,000 could expose $960, an area that attracted strong buying interest earlier in October. On the upside, bulls need to reclaim $1,100 and close above it to negate the bearish structure, with resistance ahead at $1,150 and $1,200.