BTC crash was no accident: Bitcoin’s price chart warned of potential weakness


Bitcoin’s recent plunge may have shocked casual traders, but those following the charts were well-prepared. A precise rejection from $108,900 played out exactly as predicted in earlier technical analysis.
The sharp decline in Bitcoin’s (BTC) price action wasn’t random, it was mapped out in advance. The $108,900 level was a major technical resistance zone that contained a cluster of confluences, including the value area high, the 0.618 Fibonacci retracement, a key swing high, and a bearish order block. The rejection from that level played out to the dollar, reinforcing the idea that technicals often lead fundamentals, not the other way around.
We had modeled in a prior crypto.news analysis article:
Bitcoin has shown strong momentum coming into the week following a weekend push higher. However, price is now trading in a zone that has historically acted as resistance, and the market’s reaction here will shape the near-term outlook. If this resistance is cleared with volume and conviction, a breakout to fresh all-time highs becomes increasingly likely. If price is rejected, a retracement toward liquidity-laden zones below may occur first.
Key technical points
- $108,900 Resistance: Rejection from this exact level was predicted, backed by multiple high-confluence indicators
- Liquidity Sweep: Weekend lows were a magnet, drawing price into resting liquidity for a textbook flush
- CME Futures Gap: Gap formed at $103,700 due to futures markets being closed on weekends, not due to lack of trading activity
- Support and Resistance: $98,174 weekend low and $101,455 reclaim are key zones for short-term structure
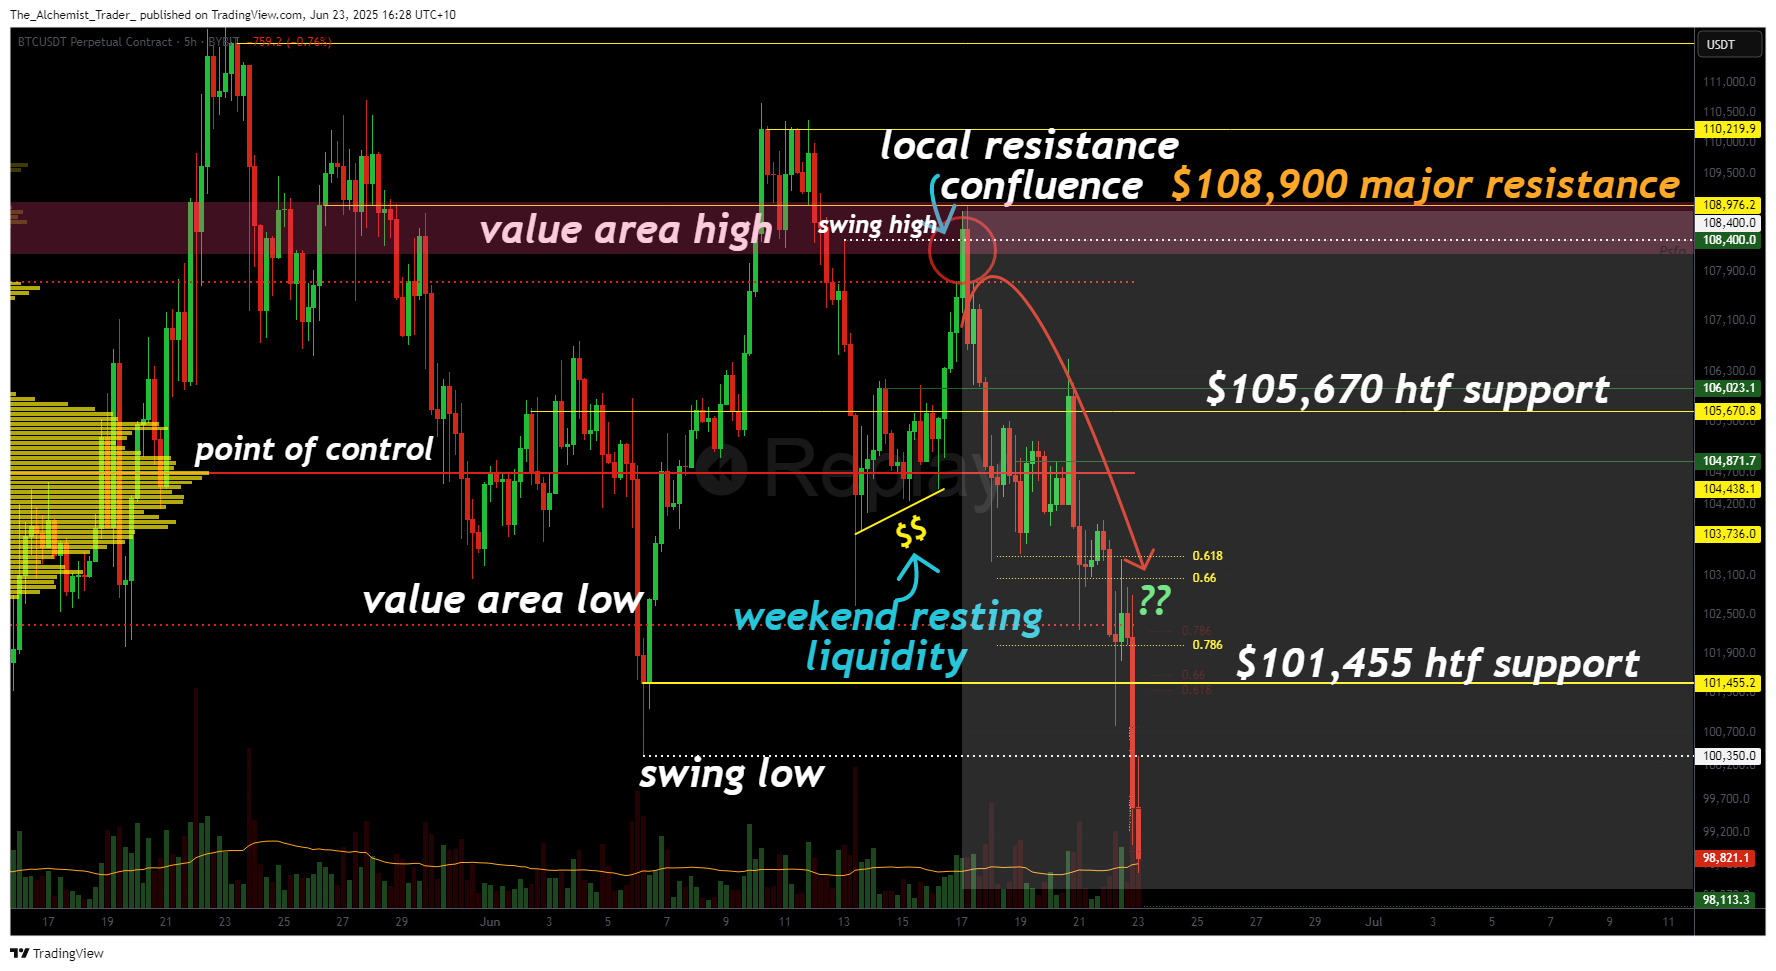
The zone discussed in the prior analysis combined multiple bearish signals: the value area high, macro resistance, the 0.618 Fibonacci retracement, and an untested bearish order block. The rejection occurred with pinpoint accuracy, triggering a sharp sell-off that swept weekend liquidity and validated the predictive power of technical confluence.
The breakdown also targeted a known liquidity pocket, taking out lows around $98,174, a region dense with resting orders, the point of control, and the value area low. As expected, price dipped through this zone in a classic liquidity grab before showing a reaction.
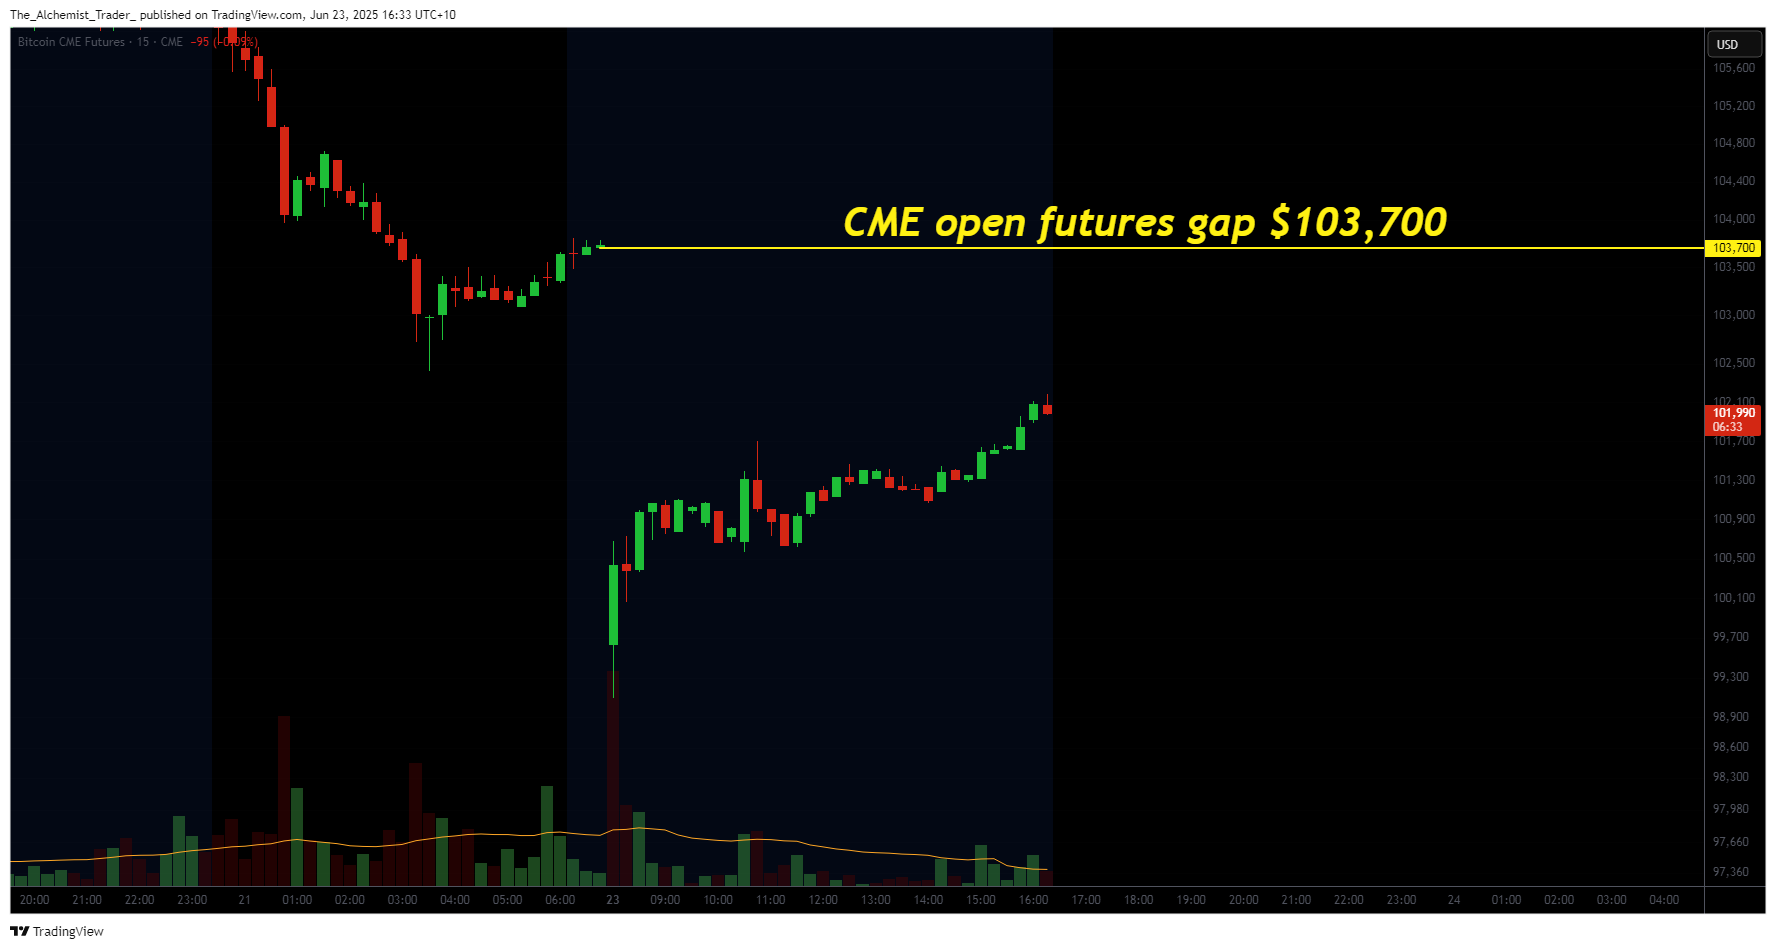
Now, focus shifts to the CME futures gap at $103,700. It’s important to clarify: this gap wasn’t created by low weekend volume, it exists because CME futures do not trade on weekends. When spot markets move while CME is closed, a gap forms that often becomes a high-probability magnet once CME reopens. Historically, over 98% of CME gaps are eventually filled.
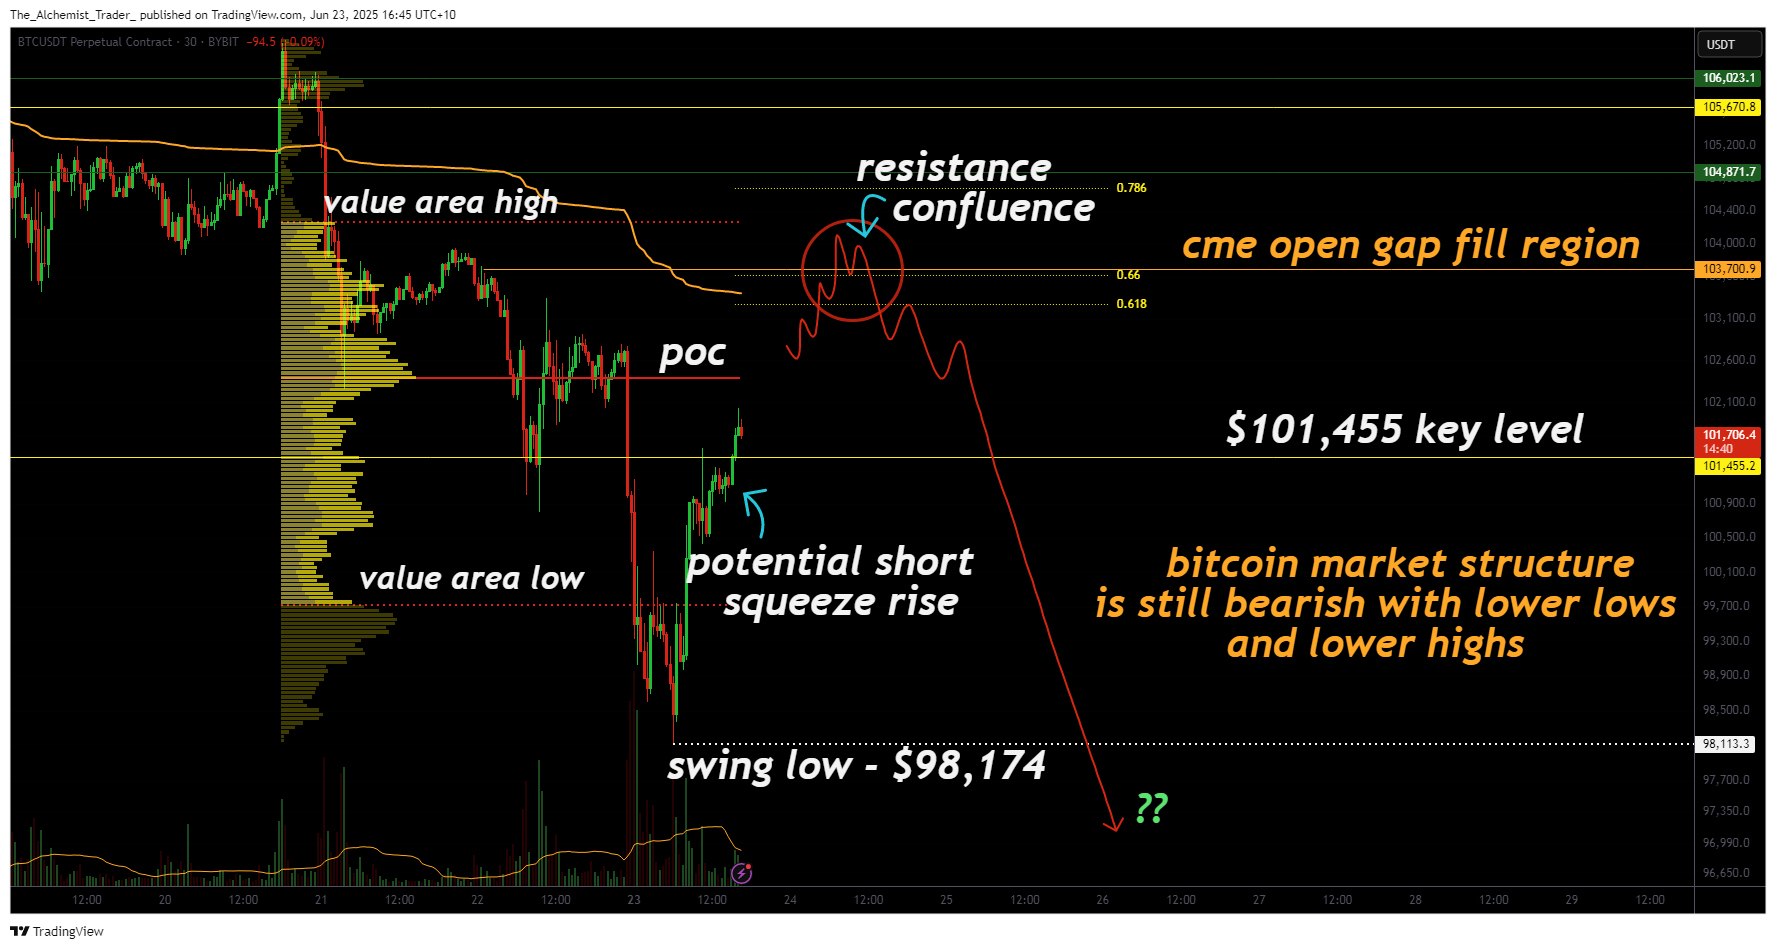
Price has since reclaimed the $101,455 level intraday, increasing the probability of a short squeeze into the CME gap zone. This area also aligns with the VWAP and 0.618 retracement, reinforcing its role as a key decision point. However, if price stalls or rejects here without strong volume follow-through, the move is likely to fade and resume the bearish structure.
Currently, Bitcoin remains structurally bearish. No confirmed higher high or higher low has formed. A failure to hold above the CME gap zone could trigger another leg lower, potentially retesting or breaking below the $98,174 low.
What to expect in the coming price action
Watch closely as Bitcoin approaches the $103,700 CME gap. If the gap is filled and price consolidates with weak or indecisive momentum, it could serve as the next rejection zone. A rejection here would reinforce the broader bearish trend and could trigger another wave of selling. Until the structure decisively shifts bullish, the technicals suggest caution remains warranted.