BTC price outlook: Bitcoin nears bullish breakout with DXY at lowest since 2022


Bitcoin price could be on the cusp of a bullish breakout, potentially reaching its all-time high as a flag pattern forms and the U.S. dollar index crashes.
Bitcoin (BTC) was trading at $107,115 on Thursday, June 25, up 8.65% from its lowest point this week.
A potential catalyst for Bitcoin is the ongoing decline in the U.S. dollar index (DXY), as Donald Trump considers candidates for the next Federal Reserve Chair. The DXY, which measures the dollar’s performance against a basket of currencies, plunged to 96.98—its lowest level since 2022.
The index has slumped nearly 12% from its highest level this year, and Morgan Stanley analysts anticipate another 9% crash. This pullback followed Trump’s brokered a truce between Israel and Iran, which ended 12 days of hostilities.
It also came after reports indicated Trump is weighing options for replacing Jerome Powell as Fed Chair in 2026, when Powell’s term ends. Leading candidates include Scott Bessent, Kevin Hassett, and Kevin Warsh.
Trump has repeatedly criticized Powell, urging him to cut interest rates. In a statement this week, Powell reiterated the Federal Reserve’s wait-and-see stance. Richmond Fed President Tom Barkin echoed that sentiment on Thursday, stating:
“There is little upside in heading too quickly in any one direction. Given the strength in today’s economy, we have time to track developments patiently and allow the visibility to improve.”
The dollar’s weakness has deepened as investors anticipate that a new Fed Chair could move quickly on interest rate cuts. In a note on Wednesday, Morgan Stanley projected the Fed would implement seven rate cuts in 2026, representing an outlook that could benefit Bitcoin and other risk assets.
Bitcoin price technicals signal a breakout is coming
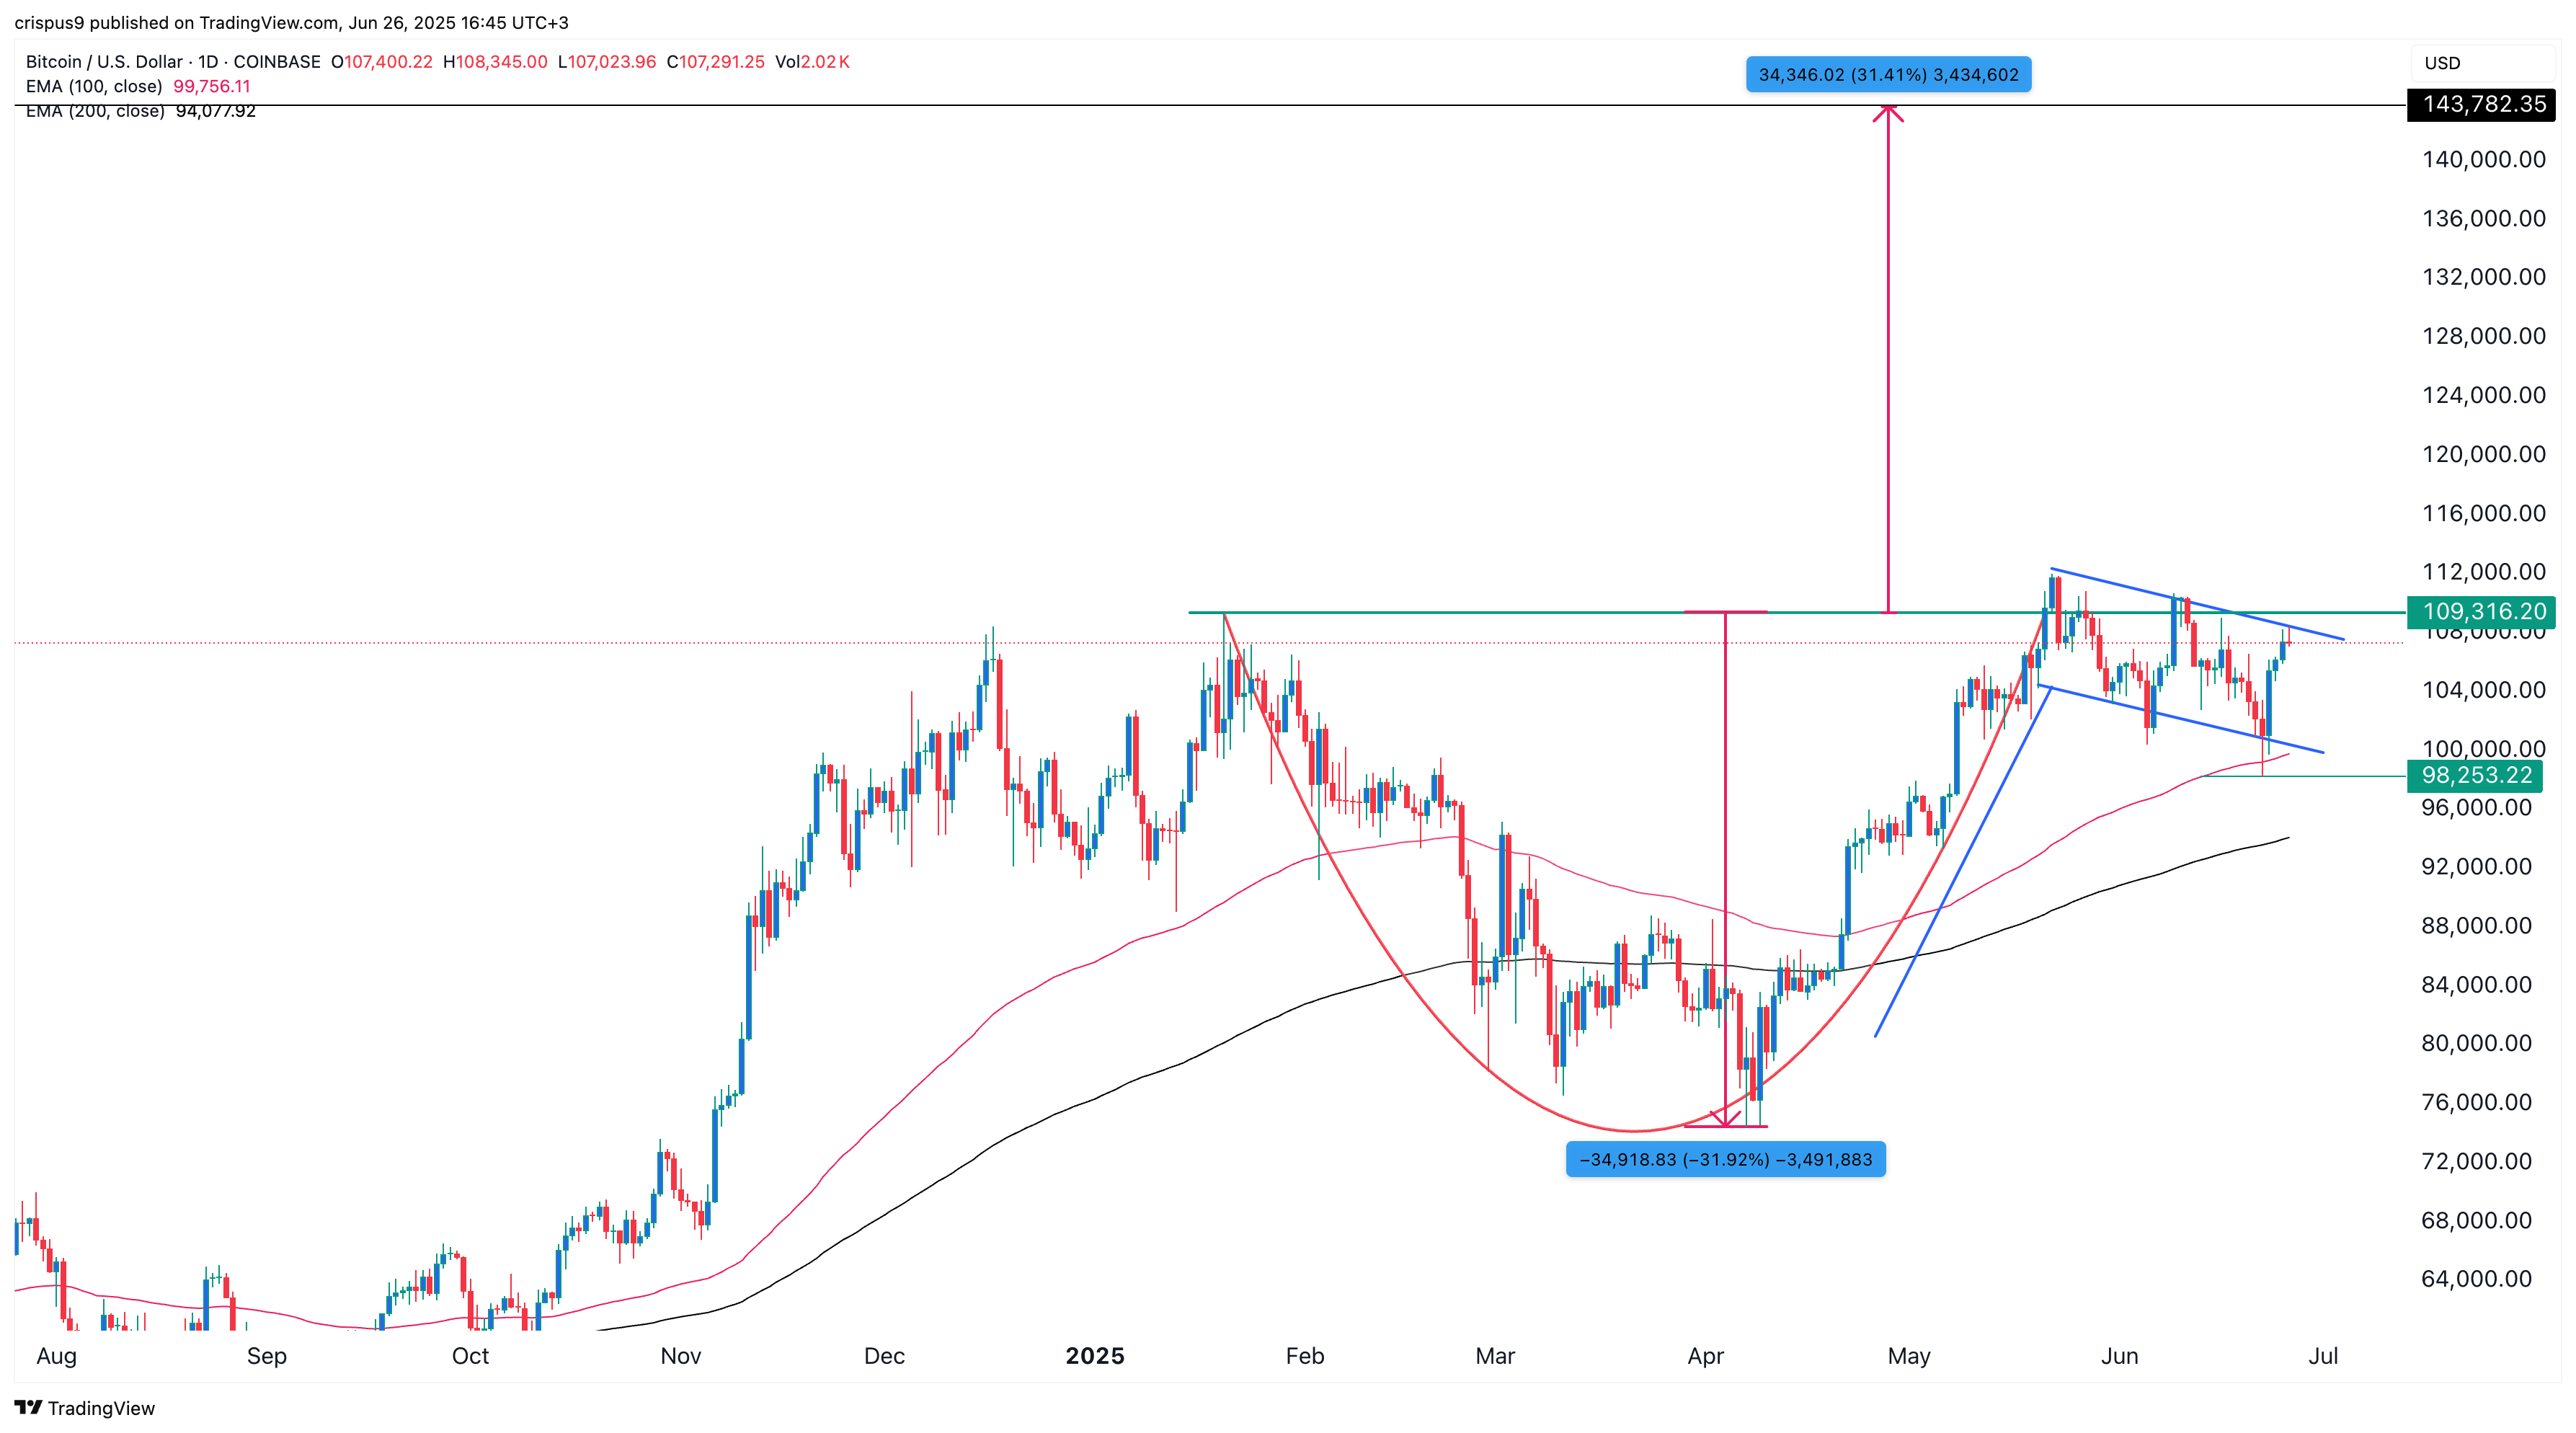
The daily chart shows that Bitcoin price has remained above the 100-day Exponential Moving Average, which has provided substantial support since April.
Bitcoin has formed a bullish flag pattern, consisting of a vertical line and a descending channel. This channel is part of the handle in a broader cup-and-handle formation.
The cup has a depth of about 31%, and projecting the same distance from the upper edge of the handle yields a target price of $143,780. A drop below the 200-day moving average at $94,000 would invalidate the bullish thesis.