BTC technical analysis paints a bullish picture for 2023


From a technical perspective, bitcoin looks like it could have a great 2023.
Bitcoin (BTC) prices continued to surge, reaching a 90-day high of $23,282.35 on Jan. 21. Despite a slight dip, BTC is still trading at a healthy $22,903 as of Jan. 24.
The positive price trend is supported by strong on-chain metrics, which suggest a smooth trailing path. Medium-term technical analysis also indicates bullish signals, pointing to continued price growth in the future.
BTC technical analysis medium-term

BTC has surged past the ceiling of a falling trend channel, indicating a slowing decline rate or the start of more horizontal development.
BTC is now caught between support at $21,000 and resistance at $25,000. A definitive breakthrough of one of these levels will signal a new direction.
Volume has been historically high at price tops and low at price bottoms, and the current volume balance is positive, further strengthening BTC’s position.
RSI above 70 shows that BTC has strong positive momentum in the short term. However, for large coins, a high RSI may signify that the coin is overbought and that there is a chance of a downward move.
On-chain metrics analysis
On-chain metrics can predict BTC price action because they clearly show how the BTC network is being used.
By tracking transaction volume, number of unique addresses, and number of active addresses, analysts can get a good idea of how much interest there is in BTC and whether or not that interest is growing.
If on-chain metrics are increasing while the price of BTC is stagnant or falling, that’s a good sign that BTC is undervalued and is likely to increase in price.
Let’s analyze key BTC on-chain metrics to understand how they corroborate with the price action.
Bitcoin transactions per day
The number of bitcoin transactions per day measures the degree of network activity and network health. An increase in the number of daily transactions may indicate increased usage of the network and a healthy network.
Meanwhile, a decrease in the number of daily transactions may indicate a decrease in network usage or an unhealthy network.
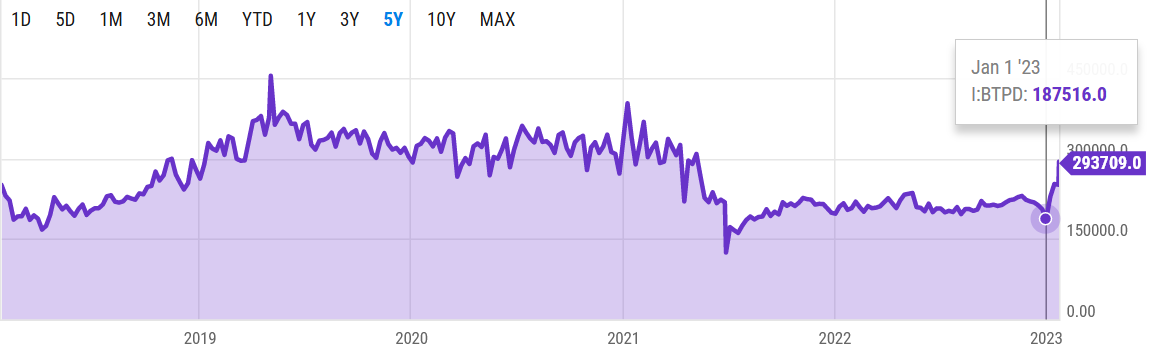
There has been a significant increase in the number of bitcoin transactions since the beginning of the year, rising from 187,516 on Jan. 1 to 293,709 as of Jan. 23. This represents a 57% increase in the number of transactions on the Bitcoin network. These levels have not been seen since mid-2021, suggesting increased activity.
This is a positive sign for the future of bitcoin as it shows that more and more people are using it for everyday transactions.
Hash rate and cost-per-transaction
The BTC hash rate is a measure of the computing power of the network.
Just like a car’s speedometer measures how many miles per hour it’s going, the hash rate measures how quickly algorithms are racing to solve a big ol’ math equation to add new blocks to the chain and reward miners.
The higher the hash rate, the faster and stronger the network is—making it harder for anyone to control it. In other words, a high hash rate = heightened security.
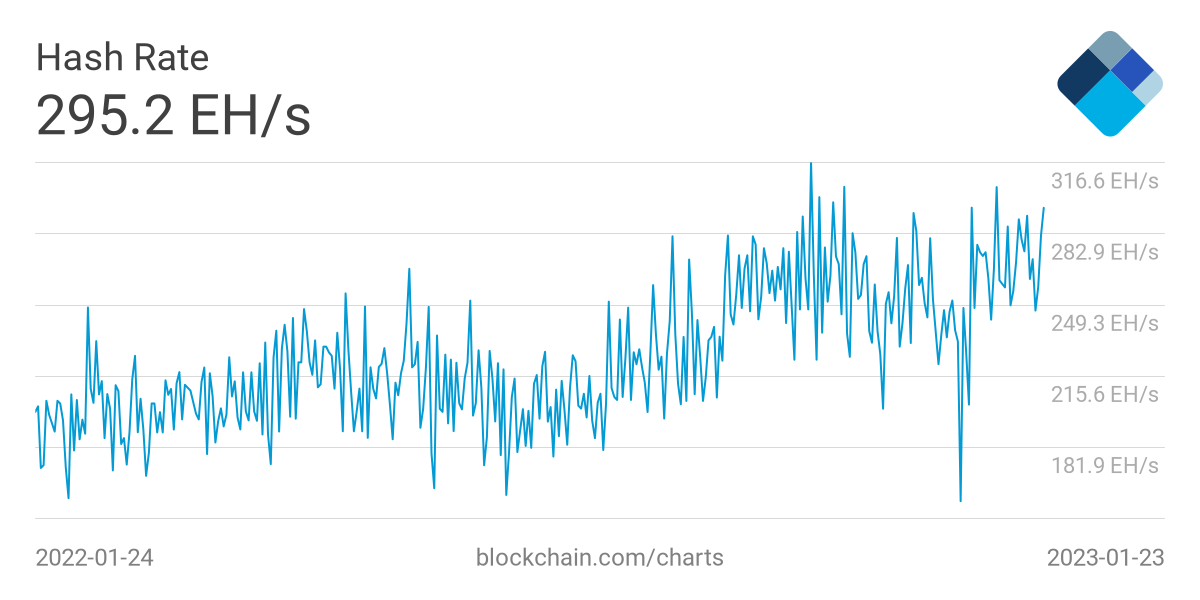
On Oct. 31, 2022, BTC’s hash rate reached an all-time high of 316.78 EH/second (exa hashes per second). However, extreme volatility caused it to fall to a low of 156.45 EH/s on Dec. 24, as BTC dipped to $16,500.
As of Jan. 24, BTC’s hash rate has quickly rebounded and reached 295.2 EH/s, almost doubling in value, suggesting increased miner activity.
The increasing hash rate is a testament to how secure the network is. Every increase in hash rate makes it more difficult to hack into or attack the network, thus contributing to decentralization.
Furthermore, the hash rate increases are happening in tandem with a significant reduction in network costs per transaction.

While miners contribute more power to the network, they are making less, with transaction fees declining, despite the steady block reward of 6.25 BTC per block.
This proves the miner’s faith, and optimism, in the Bitcoin network and serves as an extremely bullish sign for BTC price in the coming days.
Total transfer volume
The total transfer volume metric is useful for assessing bitcoin’s value. This metric looks at the total number of transactions (both incoming and outgoing) sent and received on the Bitcoin network over a given period.
Generally speaking, when the total transfer volume is higher, it can lead to increased demand, which can in turn, push the price of BTC higher. Conversely, if the total transfer volume is lower than expected, that could lead to a decrease in demand and a drop in BTC’s value.

During 2022, BTC experienced a drastic decline in total transfer value and dipped to 561,100 BTC on Dec. 4. However, its value has rebounded and reached 847,766 as of Jan. 24.
When there is an increase in total transfer volume metric, it means that there is an increase in the number of BTC transactions. This usually occurs when there is an increase in demand for BTC, increasing the price.
Where is BTC heading next?
According to a new report by Finder, fintech specialists predict BTC will reach $26,844 by the end of 2023, $77,492 by 2025, and $188,451 by 2030.
The average peak price that the panelists expect BTC to reach in 2023 is $29,095, while some believe it will go as high as $40,000. Likewise, the average lowest price they predict BTC to drop to in 2023 is $13,067, although some believe it will sink below $10,000.
Nobody knows if Bitcoin prices in 2023 will be a bull run or a bear market, but one thing’s for sure: it will be a wild ride.
After all, predicting cryptocurrency prices is like playing the lottery; you never know what you may win. So until then, buckle up and enjoy the unpredictable crypto journey!