BTC-USD Market Awaiting Break of Fractal Levels

BTC-USD is hardly changed on today’s open on the BitStamp exchange, currently trading around $416.35, up 0.28% today. A close above $417.50 today would generate a bullish signal on the daily timeframe and should see bullish momentum dominate over the weekend. Otherwise, we are likely to see range trading between $420 and $410.
The chart below shows that buyers are still in control of the market since the price action remains above the Ichimoku cloud. The cloud provides support around the $412 area as we head into the final week of March. The price action has recently closed above the conversion line after it temporarily provided minor resistance around $416; with the price action now above the conversion line, the likelihood of further appreciation in BTC-USD is higher, and support should be found around this line currently at $414.50. It has started to trend downward which gives a slight bearish indication; this trend will be further confirmed if the conversion line makes a downward cross-over of the base line.
If this cross-over occurs, then it will indicate bearish momentum in the market and see the market plunge below $412. Supports will then be found at $406.50 and $404.10. Immediate resistances lie at $419.00 and $421.91. A 4-hour session close above $419.00 will provide a signal of bullish momentum and we should see the market trend toward $440.99 (fractal resistance). On the other hand, a break below $412 will see the sellers test the psychological $400 level.
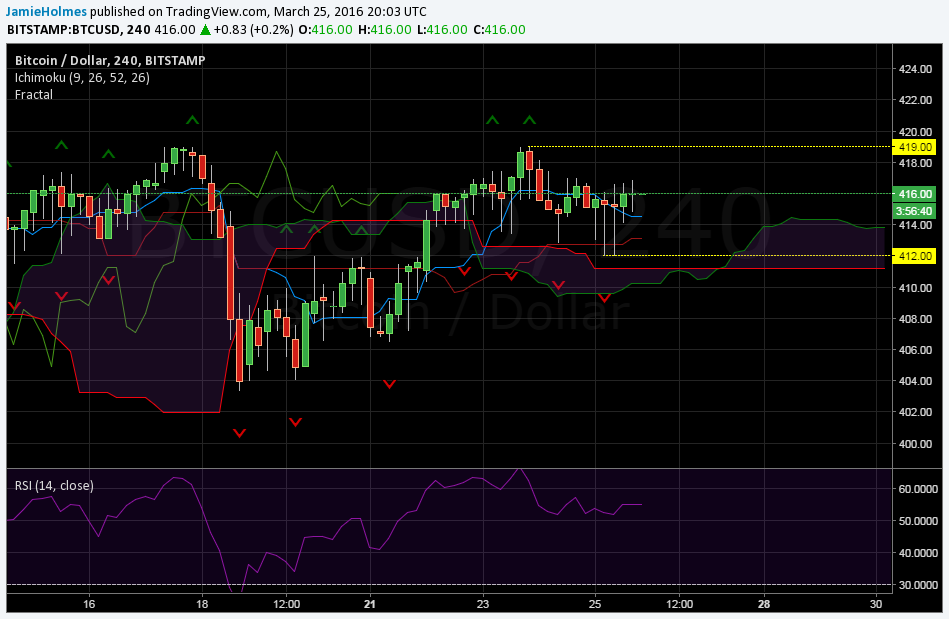
The relative strength index is above 50, also indicating bullish dominance, but is very close to the 50 equilibrium level. A cross below 50 will indicate a switch to a bearish bias. If the index starts to trend higher then this will give bullish confirmation and will indicate a possible break of the fractal resistance at $419.00.
The shorter-term outlook is illustrated by the hourly price action below and shows how the market is trying to attempt a ‘Kumo’ breakout to the upside. If the price action manages to break above the Ichimoku cloud or ‘Kumo,’ then further swings to the upside are favored. The most recent fractal levels are also shown on the chart with a break above $416.69 required for a bullish outlook and a break below $414.87 required for bears to take control.
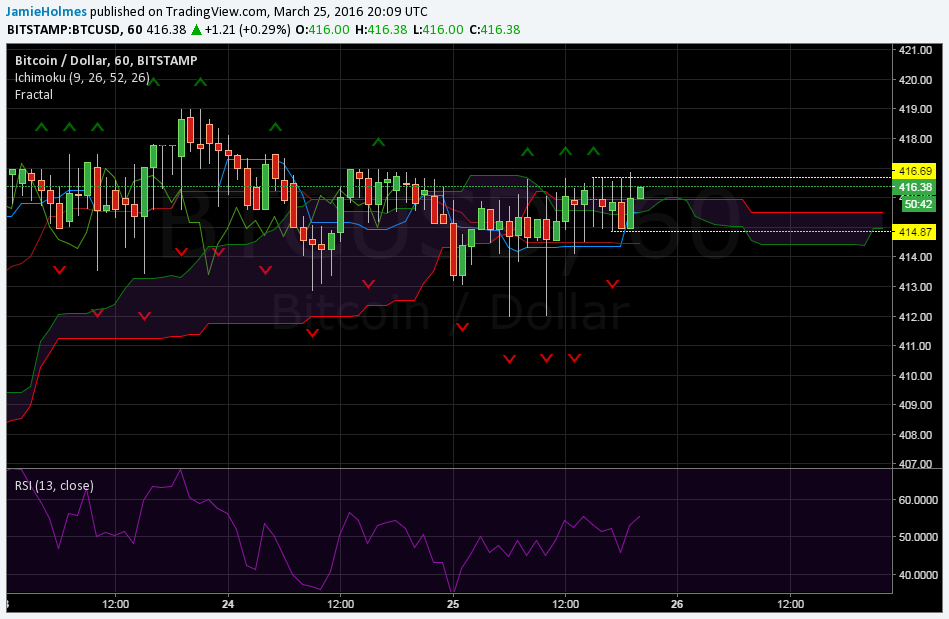
A bullish indication given by the chart above is that the conversion line has recently moved above the base line suggesting a switch in momentum. Further confirmation will be given if the Ichimoku cloud changes color from red to green. The relative strength index is safely in the bullish zone and trending upward, which favors buying positions. However, since the Ichimoku cloud is currently providing resistance, a turn downward could mean that selling positions could be favored all the way down until $412.00.