Can Ethereum price hit $5,000 as ETH ETF outflows rise?


Ethereum price moved sideways this week as demand from retail and institutional investors remained weak.
- Ethereum price pulled back as ETH ETF outflows jumped.
- The coin has numerous catalysts, including its stablecoin growth.
- ETH price has formed a bullish flag pattern, pointing to a rebound.
Ethereum (ETH) token was trading around $3,930 on Saturday, Oct. 25 — a level it has remained at in the past few days. This price is a few points above its lowest level this month.
ETH ETF outflows continued
One of the main reasons why Ethereum price remained under pressure is that institutional demand remained weak as fear prevailed. Data compiled by SoSoValue shows that Ethereum ETFs had over $243 million in outflows this week. They had $311 million in outflows in the previous week.
Ethereum ETFs have now recorded cumulative inflows of over $14.35 billion since their approval in 2024. They now manage over $26 billion in assets, with the iShares Ethereum Trust accounting for $15.6 billion.
Ethereum ETF outflows coincided with a sense of market fear. Data compiled by CoinMarketCap shows that the Crypto Fear and Greed Index remains in the fear zone of 34. Also, the Altcoin Season Index has dropped to 23, a sign that demand for alternatives to Bitcoin has waned.
Still, Ethereum price has catalysts for a potential rebound. One of these key catalysts is the ongoing performance in the stablecoin industry. Data compiled by Artemis shows that stablecoin supply in the network has increased by 2.78% in the last 30 days. The adjusted transaction volume has risen to $975 billion in this period.
Ethereum has also become a dominant player in the decentralized exchange industry. Its protocols handled transactions worth over $148 billion in the last 30 days. All this has led to a higher revenue in the network. Revenue jumped to $1.26 million in the previous 24 hours.
Ethereum price technical analysis
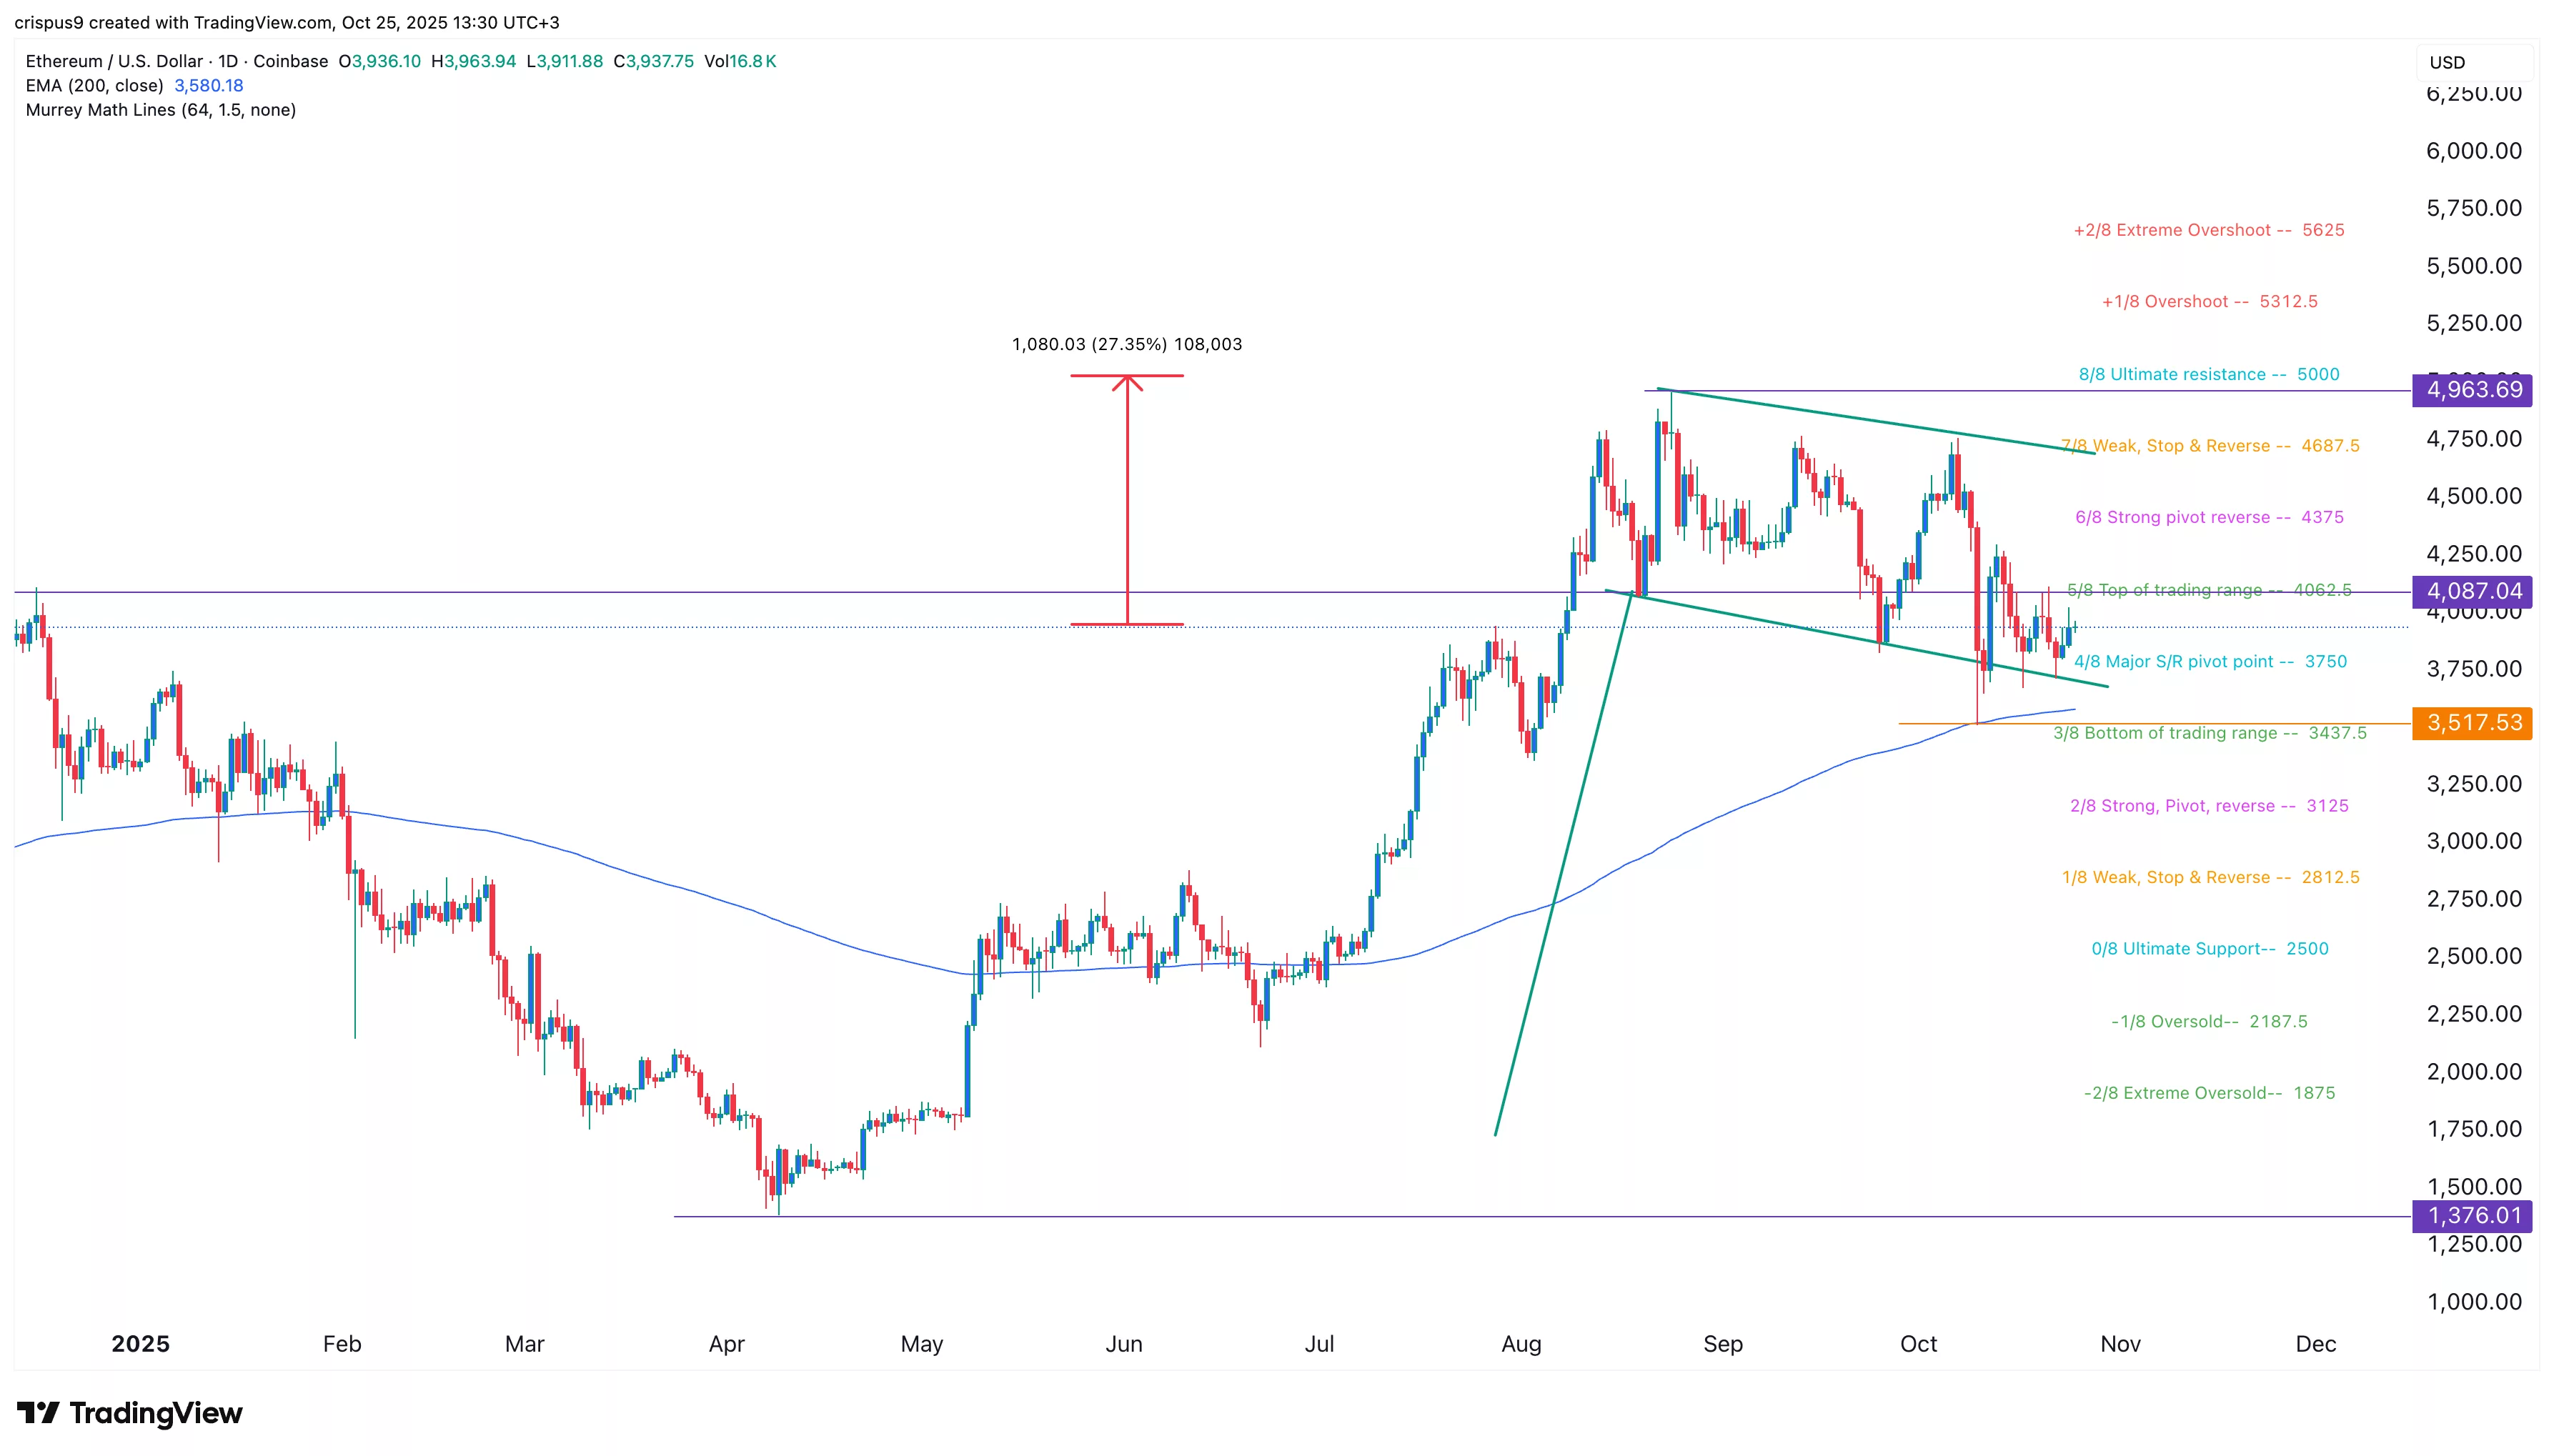
The daily chart shows that the ETH price has bounced back from a low of $1,376 in April to a high of $4,963 in August. It has remained above the 200-day Exponential Moving Average, which is a bullish sign.
Ethereum price has also formed a bullish flag pattern, which is made up of a vertical line and a descending channel. This pattern often results in a strong bullish breakout.
The coin remains above the Major S/R pivot point of the Murrey Math Lines. Therefore, it will likely have a strong bullish breakout, potentially to the ultimate resistance at $5,000, which is about 27% above the current level.