Cardano price could surge 110%, but there’s a catch

The Cardano price has formed a rare bullish chart pattern, indicating a potential 110% surge; however, a sharp decline in a key metric raises concerns.
Cardano (ADA), a popular layer-1 network, was trading at the important resistance level of $0.65, the upper side of the falling wedge pattern.
Fundamentals suggest that Cardano may continue rising. The most important fundamental is its integration with BitcoinOS, which happened in October last year. This integration opens the door to Bitcoin (BTC) staking, a feature that will enable BTC holders to generate a regular income.
Bitcoin staking on Cardano is expected to be a safer and decentralized approach compared to traditional centralized method of using companies like Celsius. Celsius collapsed in 2022, resulting in nearly $5 billion in losses.
It will utilize zero-knowledge cryptography, a secure option that enables one party to prove to the verifier that a statement is true without revealing the underlying data. Charles Hoskinson, the founder of Cardano, believes that this integration will lead to billions of dollars in assets flowing into the network.
Cardano’s other catalyst is that there are signs that the Securities and Exchange Commission will approve a spot ADA ETF later this year. Polymarket traders have assigned odds of almost 60% to this happening.
However, on-chain data shows that Cardano whales have been offloading their tokens recently. They sold over 180 million ADA tokens between April 13 and 18.
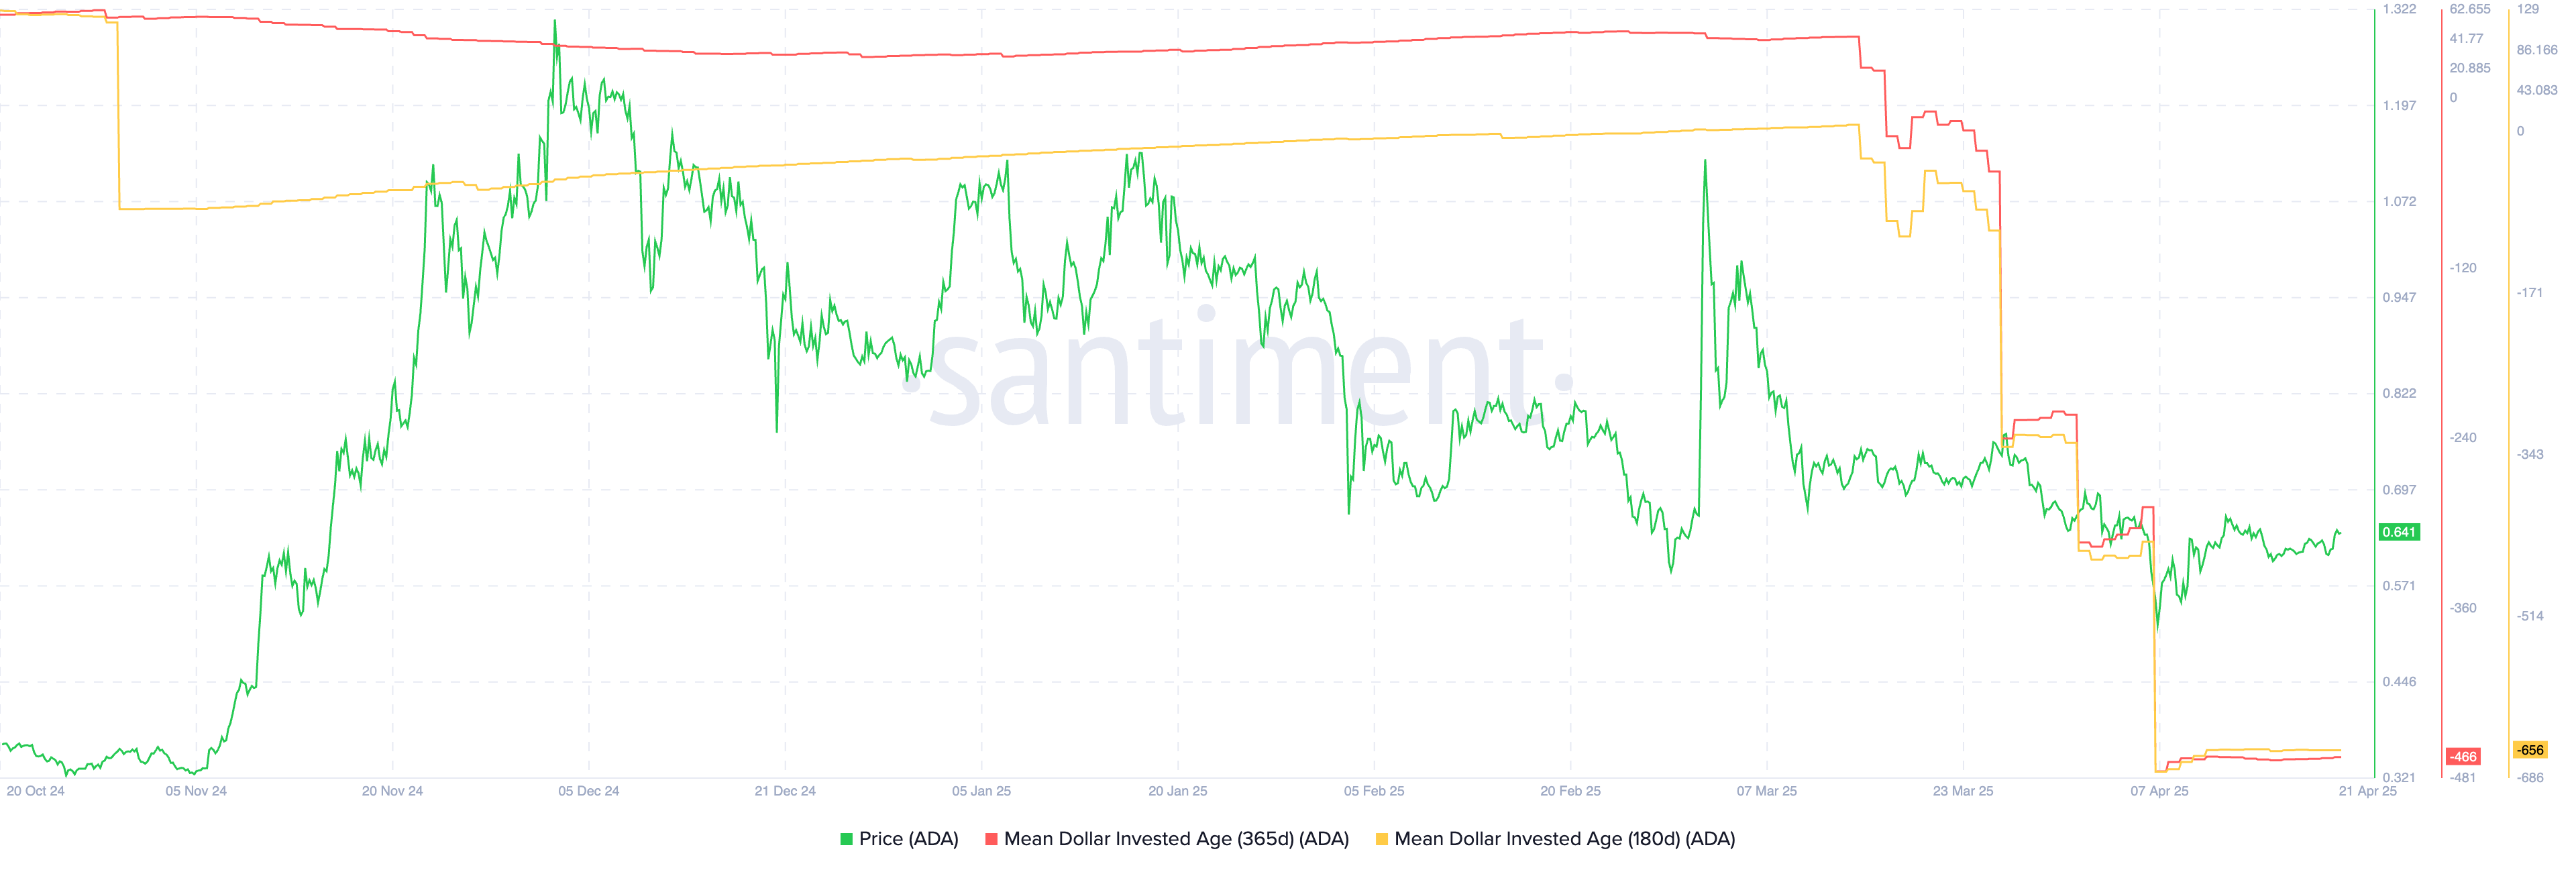
Another data shows that the 365-day and 180-day Mean Dollar Invested Age figure have plummeted in the past few weeks. The 365-day figure dropped from 43 in March to minus 466, while the 180-day figure moved from 6.8 to minus 656.
An MDIA figure looks at the average time that dollars invested in a coin remained dormant in their current addresses. A falling figure means that previously dormant tokens are being moved, a sign of capitulation.
Cardano price analysis
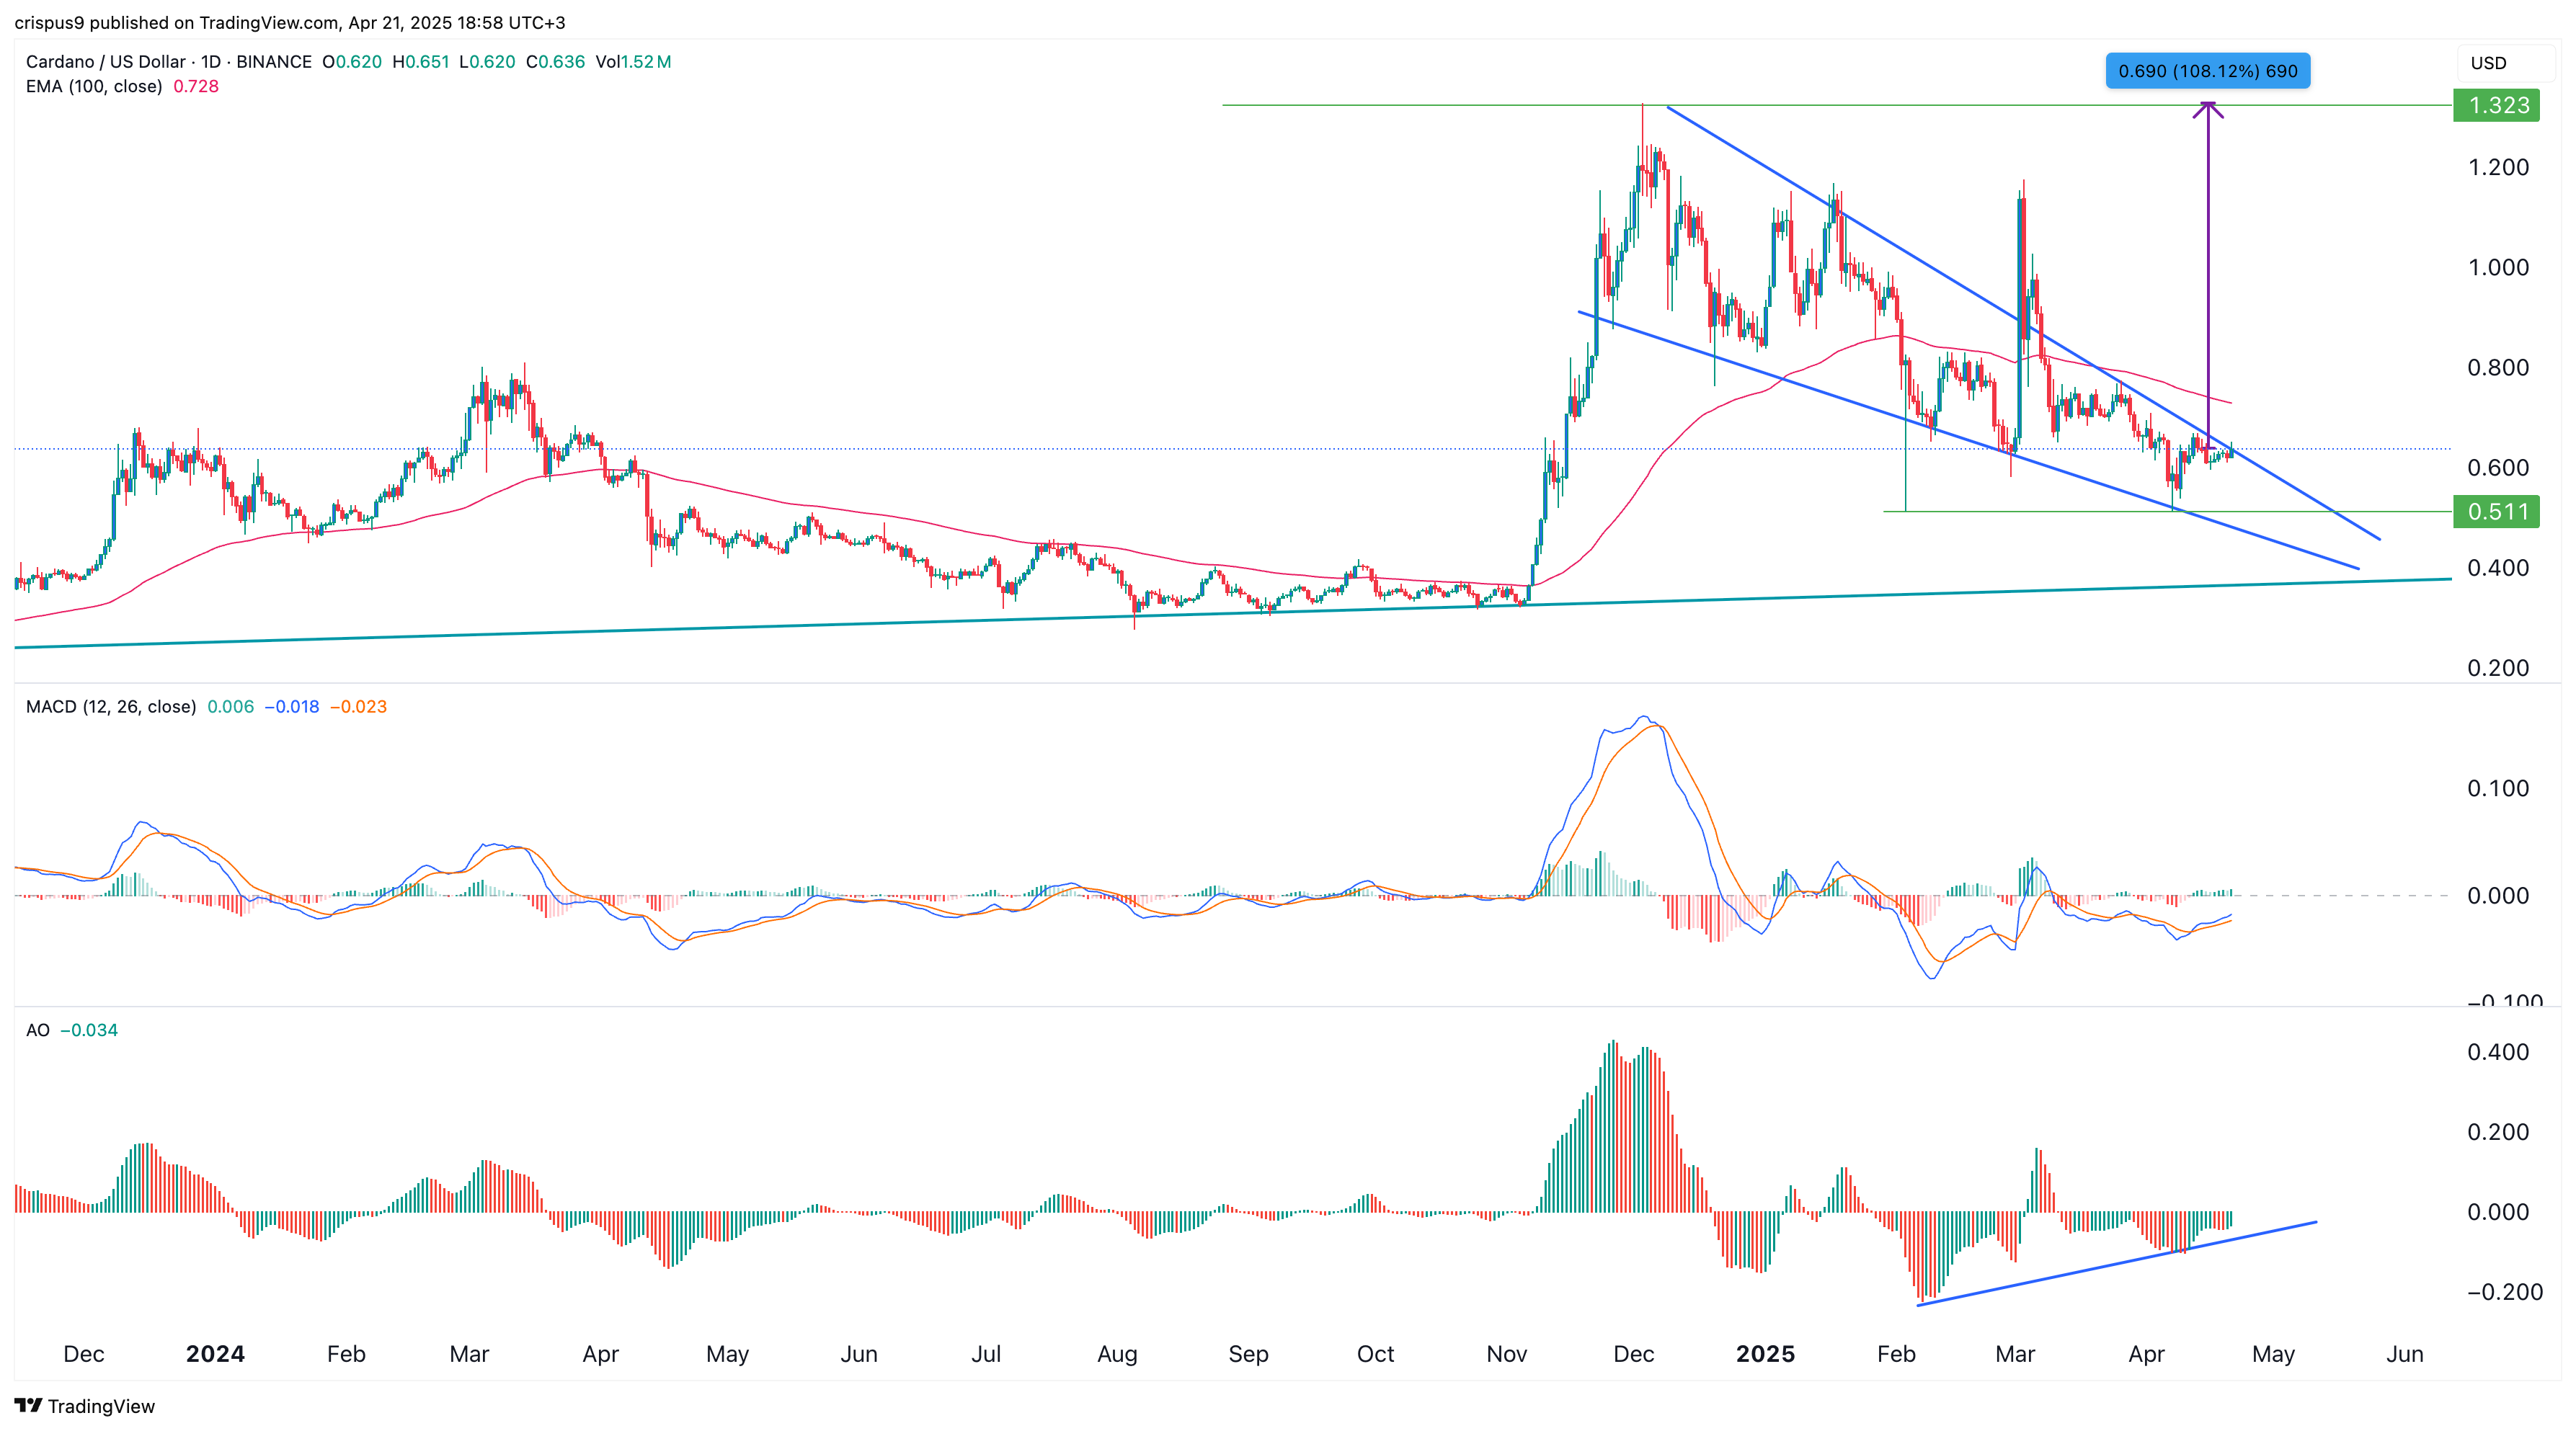
The daily chart shows that the ADA price has been in a strong sell-off in the past few months. It dropped below the 100-day and 50-day moving averages as the sell-off intensified.
Fortunately, there are signs that Cardano may rebound and even double and reach its highest point in November last year. It has formed a falling wedge, which happens when two trendlines near their confluence level.
Cardano has also formed a bullish diverge as the Awesome Oscillator and the MACD indicators have risen. Therefore, further gains are likely to be confirmed if it rises above the 100-day moving average at $0.728. A drop below the support at $0.51 will invalidate the bullish view.