Cardano re-enters multi-year range: weakness signals move toward lower support


Cardano (ADA) has shown major structural developments as it re-enters a multi-year trading range. The recent price action suggests acceptance back within this long-term structure, with indicators pointing toward a potential move to the lower support region.
Cardano (ADA) has re-entered a significant trading range that has contained its price action for over three years. After a breakout in late 2024 that lacked volume strength, the asset has failed to sustain its highs and is now showing signs of weakness. For traders, this shift back into the range carries major implications for ADA’s medium- to long-term price trajectory.
Key points covered
- ADA has closed multiple candles back within a multi-year trading range, signaling true acceptance
- The 2024 breakout lacked volume confirmation, indicating a potential climactic top
- A move towards the lower support region is increasingly likely as ADA seeks true market value
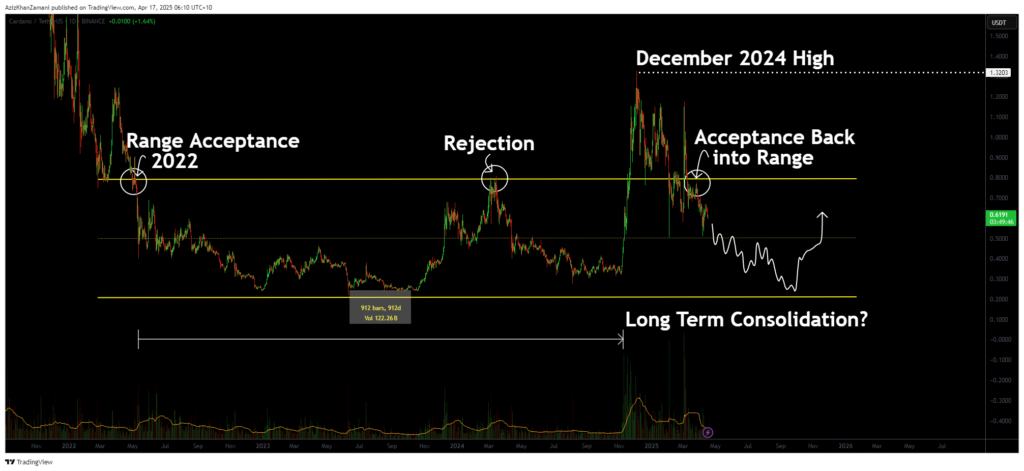
After more than 912 days of trading within a well-defined range since 2022, ADA finally broke out in December 2024, setting a new high. However, this breakout lacked the critical component of follow-through volume. A sharp drop in volume immediately after the breakout signaled weakening momentum, suggesting a climactic top rather than a sustainable bullish trend.
Price action has since fallen back below the range high and closed multiple candles beneath it, a clear sign of acceptance back within the range. This is significant from a structural standpoint. Rather than consolidating above and building new support, ADA is now signaling a potential return to its value zone, likely toward the lower bound of the long-term range.
The volume profile reinforces this theory. The expansion to the December highs was not matched by sustained buyer interest. Instead, volume sharply tapered off, indicating that the breakout may have been speculative and not backed by conviction. In such cases, price often returns to equilibrium levels to reassess fair market value.
What to expect in the coming price action
With ADA now firmly back inside the long-term range, a slow grind toward the lower support region is increasingly probable. Traders should exercise patience, avoiding premature entries until there is either a confirmed trend reversal or a test of the lower boundary. The real opportunity may lie in ADA’s eventual consolidation and structure near the bottom of this historical range.