Chainlink price flash crashes as a risky pattern slowly emerges


Chainlink price dropped for two consecutive days, reaching its lowest level since January 2, as the crypto market sell-off accelerated.
- Chainlink price has formed a bearish pennant pattern on the daily chart.
- It has also formed a small double-top chart pattern.
- These patterns point to more downside in the near term.
Chainlink (LINK) token retreated to a low of $12.8, down by nearly 12% from its highest point this month, and by 55% from its 2025 highs.
LINK’s decline coincided with the performance of Bitcoin and other tokens. It also happened as the stock market in Europe and US futures dropped. This retreat was mostly because of Donald Trump’s decision to start a trade war with a few NATO countries.
Chainlink also dropped as futures open interest dropped and liquidations jumped. Open interest in the crypto industry dropped by 2.6% in the last 24 hours to $138 million, while liquidations rose by 770% to $873 million.
Chainlink’s open interest dropped to $620 million from the year-to-date high of $708 million. Bullish positions worth over $3.3 million were liquidated in this period.
Meanwhile, demand for LINK ETFs has been relatively weak since their approval in December. Grayscale’s GLNK ETF has accumulated over $87 million in assets and $64 million in cumulative inflows. Bitwise’s CLNK, which was launched last week, has accumulated nearly $2.6 million in assets.
Still, on the positive side, Chainlink has some of the best fundamentals in the crypto industry. For example, it has become the biggest oracle network in the crypto industry with over $60 billion in total value secured.
Chainlink has also become a major player in the fast-growing real-world asset tokenization industry. Its Cross-Chain Interoperability Protocol is widely used by some of the biggest companies and institutions globally.
Additionally, the Strategic LINK Reserve has continued accumulating tokens and currently holds tokens worth over $20 million.
Chainlink price technical analysis
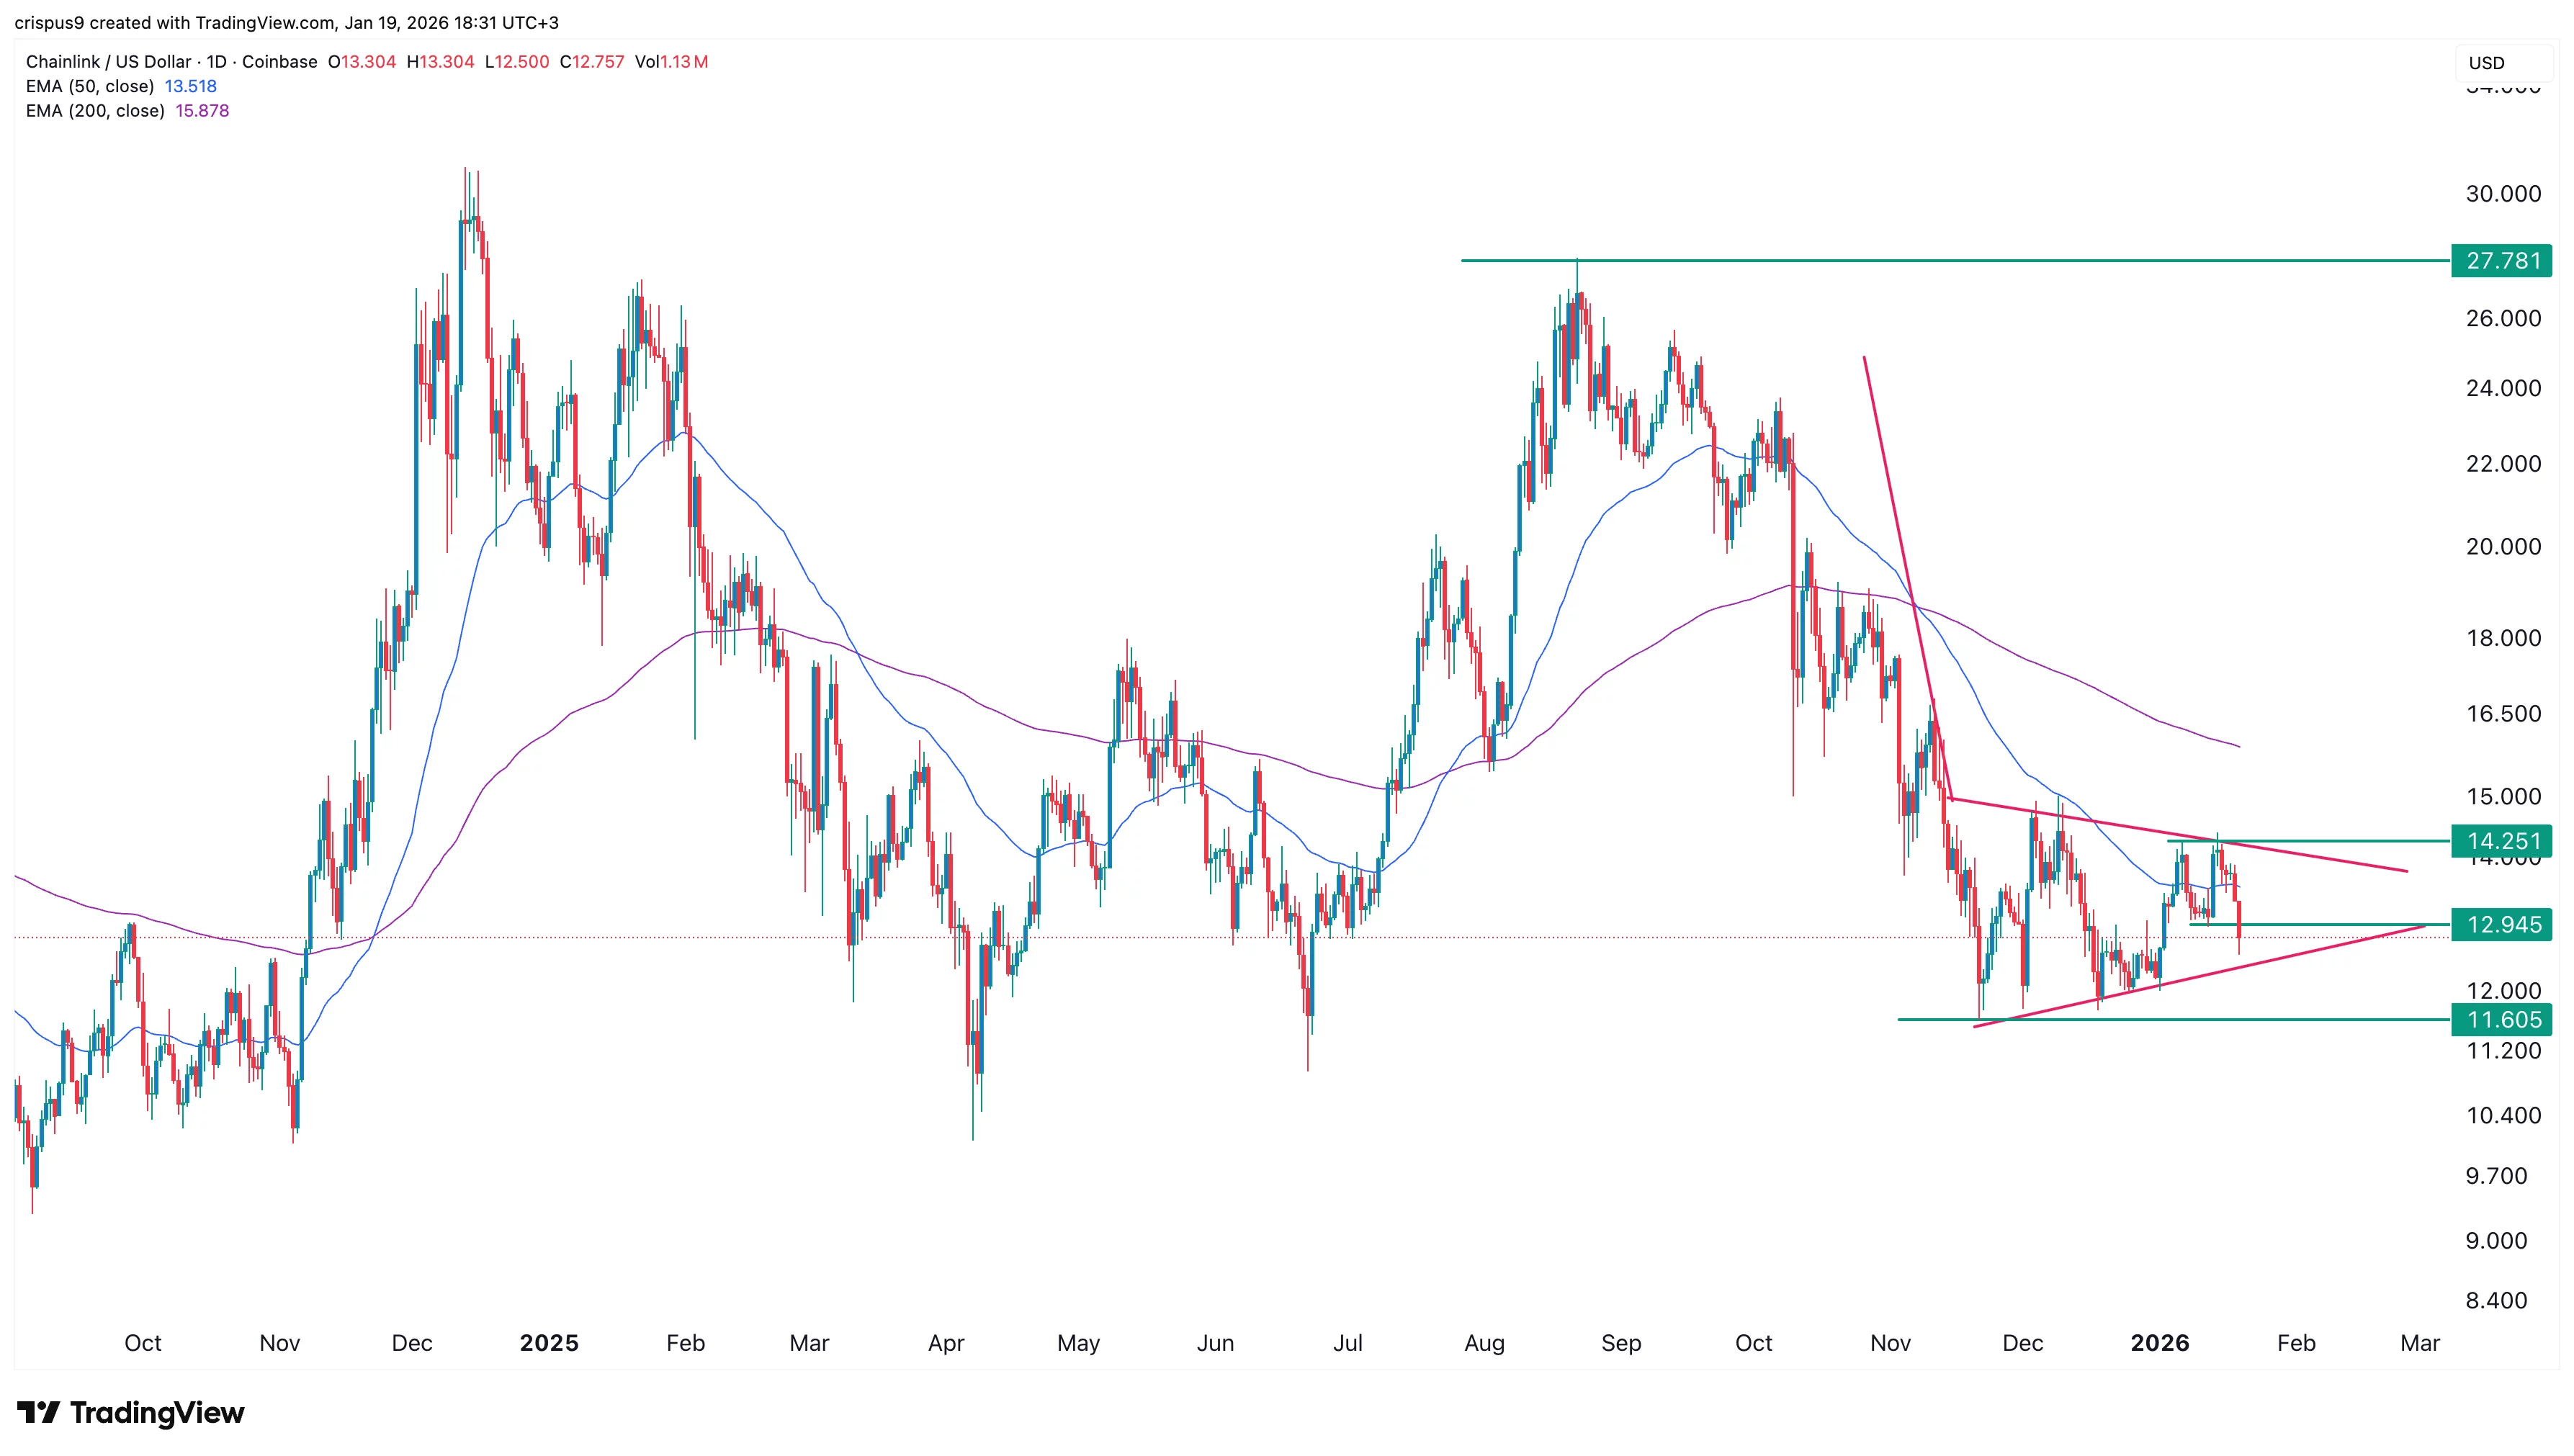
The daily chart shows that the LINK price has crashed in the past few months. It has dropped from a high of $27.78 in August to the current $12.80.
The coin formed a death cross pattern on Nov. 6 as the 50-day and 200-day Exponential Moving Averages crossed each other. This death cross is one of the riskiest patterns in technical analysis.
The coin has also formed a bearish pennant pattern, which is made up of a vertical line and a symmetrical triangle pattern. The two lines of this triangle are now nearing their confluence level.
It has also formed a small double-top pattern at $14.25 and a neckline at $12.95. Therefore, the token will likely have a strong bearish breakout, potentially to the November low at $11.60.