Chainlink price forms bearish setup as it nears multi-year support, crash incoming?


Chainlink price has formed multiple bearish patterns that suggest its ongoing downtrend could extend over the coming weeks.
- Chainlink price is down nearly 50% from its yearly high.
- LINK price is close to confirming a death cross on the 1-day chart.
According to data from crypto.news, Chainlink (LINK) hit a yearly high of $27.70 in August this year. It has since dropped by 49% to $14.05 last check on Monday, Nov. 17.
Chainlink price entered the downtrend amid broader macroeconomic headwinds, including investor concerns surrounding U.S. tariffs on key economies and diminishing hopes of another rate cut by the Federal Reserve in December.
Data from DeFiLlama shows that the total value locked in all Chainlink-based DeFi applications has fallen to $608.14 million, significantly lower than $1.13 billion held in late August this year. Weekly fees generated by these protocols have also dropped 45% in the period.
Declining TVL and fees mean that the overall usage and demand for Chainlink’s services within the DeFi space have weakened, as activity over the network has slowed down, leading some investors to move towards alternative oracle solutions in recent months.
Chainlink price analysis
On the daily chart, Chainlink price has formed a multi-year symmetrical triangle pattern. The pattern is usually neutral in nature; however, breakouts from the upper or lower trendlines from which it is formed can decide the direction of the next major move.

At press time, LINK price appeared to be approaching a breakdown from the lower boundary of the pattern, a zone where buying interest has repeatedly emerged each time it dipped to these levels. However, the current momentum suggests that buyers may be losing strength.
Adding another layer of bearish pressure, the 50-day simple moving average is on the verge of crossing below the 200-day simple moving average. If this crossover takes place, it would confirm a death cross, a historically reliable indicator of sustained downtrends in the weeks that follow.
For now, the key support level for LINK stands at $11.06, which coincides with the 38.2% Fibonacci retracement level.
A drop below this would strongly and clearly confirm the breakdown from the symmetrical triangle pattern and could drive further losses to $10 or lower.
However, data from Nansen shows that the amount of tokens held by whale addresses has increased by 20% to 2.06 million over the last 7 days.
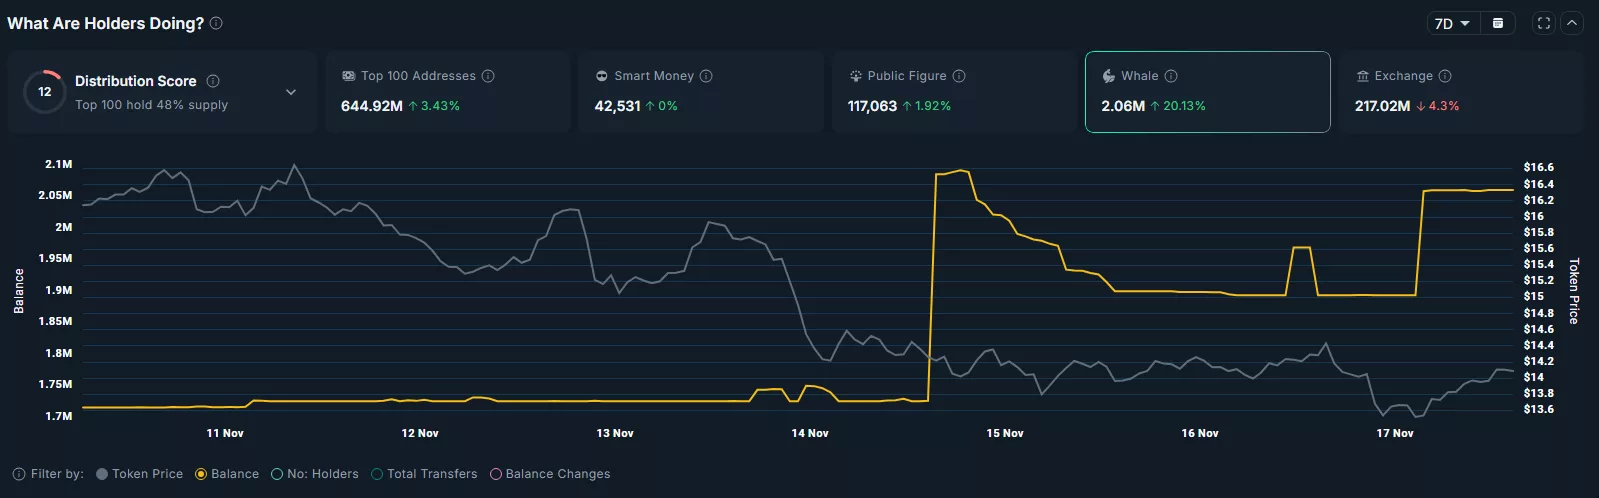
While it does not fully negate the risk of further downside, such concentrated buying activity might help stabilize prices near current support levels. If retail traders interpret this as a sign of renewed confidence from experienced market participants, it could limit the severity of any potential correction in the short term.
Disclosure: This article does not represent investment advice. The content and materials featured on this page are for educational purposes only.