Chainlink price nears breakout on ETF buzz, will it reclaim August highs?


Chainlink price is close to a breakout from a bullish reversal pattern as hype surrounding the launch of its spot ETFs continues to build across the broader market.
- Chainlink price is down 26% over the past month.
- Community hype surrounding upcoming spot ETF launches has renewed demand from whales.
- A bullish reversal pattern has formed on the daily chart.
According to data from crypto.news, Chainlink (LINK) rallied for the fifth straight day on Thursday, Nov. 27, and rose nearly 3% over the last 24 hours. Trading at $13.43 when writing, the token still remains 25.8% below where it last traded at exactly a month ago and nearly 50% under its August high of $26.75.
Chainlink price recovered recently amid investor anticipation over the potential launch of two spot ETFs, possibly by December, from investment managers Grayscale and Bitwise.
Such investment products would open the door for institutional investors who could gain exposure to LINK tokens without having to directly acquire or hold the underlying cryptocurrency. Spot ETF demand can help support its price upside over the long run.
Meanwhile, whales have already begun accumulating LINK in anticipation of the launch. Per data from Nansen, these holders now own 2.26 million LINK tokens, up from 1.67 million on Nov. 20.
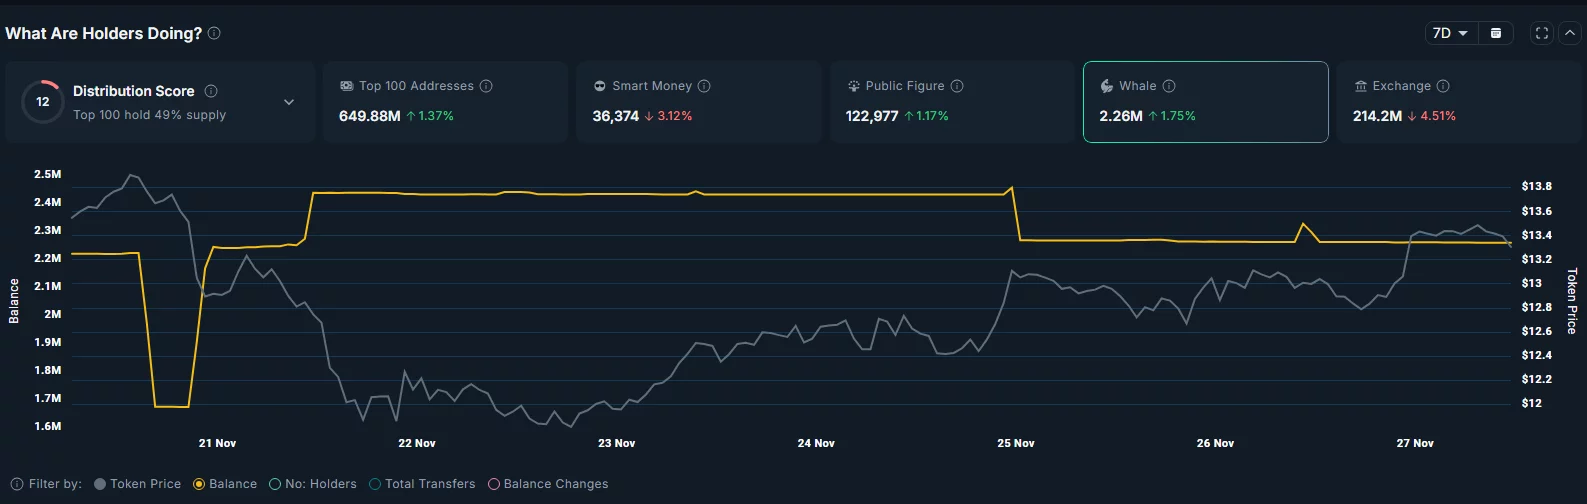
Additional data shows that the total supply of LINK tokens held across exchanges has dropped by 4.5% over the past 7 days. Exchange outflows tend to support prices as they indicate a reduced supply of tokens readily available for sale, reflecting a more bullish outlook among investors.
Chainlink price analysis
On the daily chart, Chainlink price is eyeing a breakout from a falling wedge pattern formed when the price moves within two downward-sloping and converging trendlines, reflecting a period of consolidation. It typically tends to signal a bullish reversal in ongoing downtrends, especially when accompanied by rising volume or supportive momentum indicators.
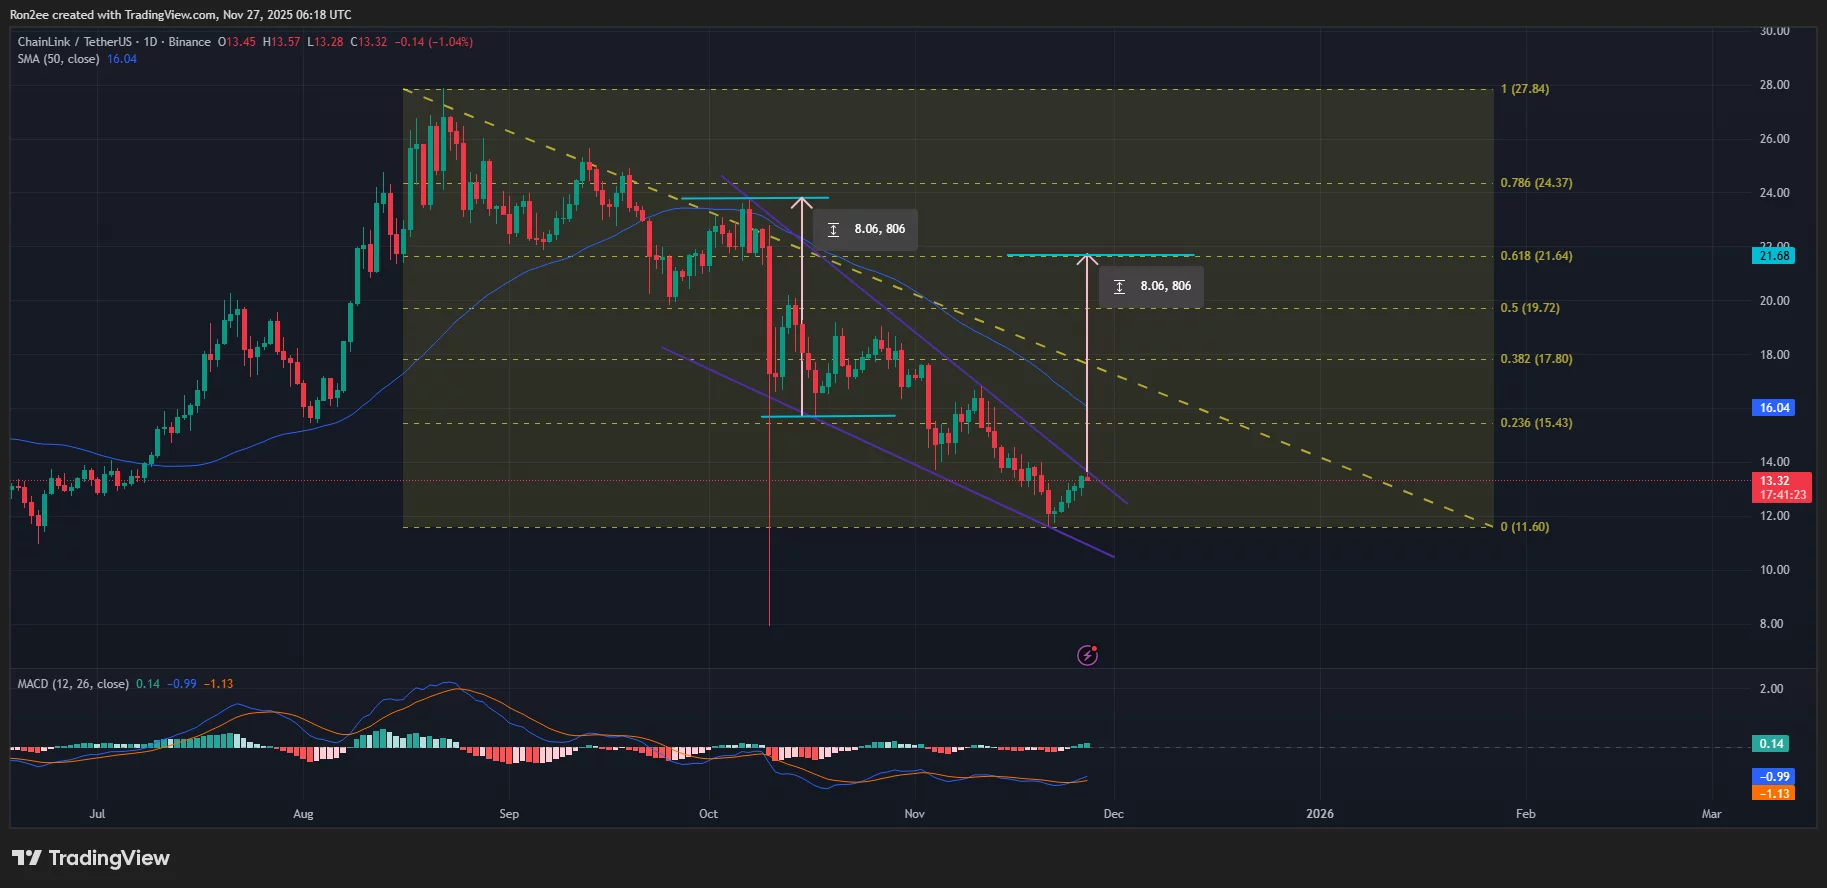
Momentum indicators like the MACD are supporting this outlook, as it has formed a bullish crossover with the signal line, indicating growing buying pressure.
Hence, a breakout from the falling wedge could mean a move above the 50-day simple moving average, which may lead to a rally toward $21.6, a level that aligns with the 61.8% Fibonacci retracement drawn on the chart.
A decisive break above this level with strong volume backed by positive market sentiment could enable LINK to retest its August high of $26.75, which lies nearly 100% above its current price.
Disclosure: This article does not represent investment advice. The content and materials featured on this page are for educational purposes only.