Bitcoin
Bitcoin (BTC)
$102,689.00 3.87154
Bitcoin price
Ethereum
Ethereum (ETH)
$2,215.32 16.94679
Ethereum price
BNB
BNB (BNB)
$626.47 2.79281
BNB price
Solana
Solana (SOL)
$162.47 7.94247
Solana price
XRP
XRP (XRP)
$2.30 4.96517
XRP price
Shiba Inu
Shiba Inu (SHIB)
$0.0000142 7.67453
Shiba Inu price
Pepe
Pepe (PEPE)
$0.0000109 25.67231
Pepe price
Bonk
Bonk (BONK)
$0.0000201 10.76275
Bonk price
dogwifhat
dogwifhat (WIF)
$0.66993 10.90333
dogwifhat price
Popcat
Popcat (POPCAT)
$0.474269 4.12531
Popcat price

Chainlink’s chart shows the first RSI bullish divergence ever

News
<strong>Chainlink’s chart shows the first RSI bullish divergence ever</strong>

Chainlink — the biggest on-chain data (oracle) protocol — is seeing its LINK token shine a bright green light according to this technical indicator.

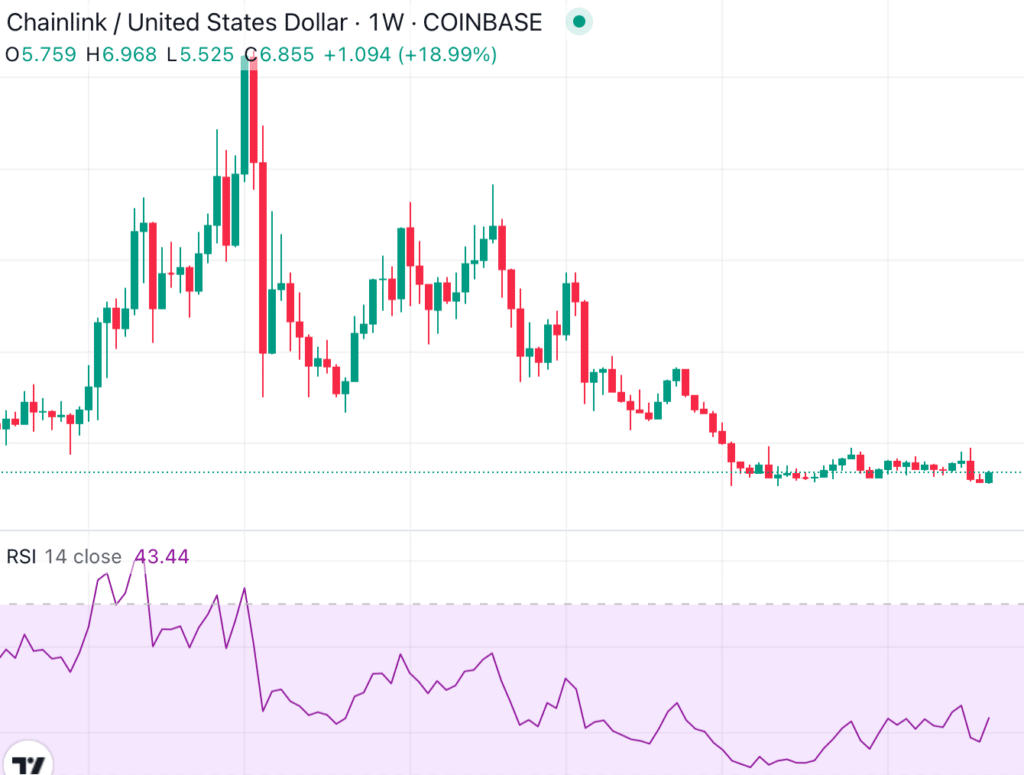
Chainlink chart analysis shows that the weekly RSI is trending upwards in a bullish divergence while the price continues trading lower — a sign never seen before on the weekly chart for this token. The current weekly RSI of 43.33 suggests that the coin is picking up upwards momentum.

<strong>Chainlink's chart shows the first RSI bullish divergence ever</strong> - 1

According to Investopedia, “a bullish divergence occurs when the RSI displays an oversold reading followed by a higher low that appears with lower lows in the price.” The trading education website is quite clear as to the meaning of such an indication:

“This may indicate rising bullish momentum, and a break above oversold territory could be used to trigger a new long position.”

As of press time, Chainlink is trading at $6.84 after seeing a price increase of nearly 7% over the last 24 hours. The bullish momentum may propel LINK’s ascension towards the resistance located in the $9 area.