Chart of the week: Helium’s 158% rally may be nearing a turning point


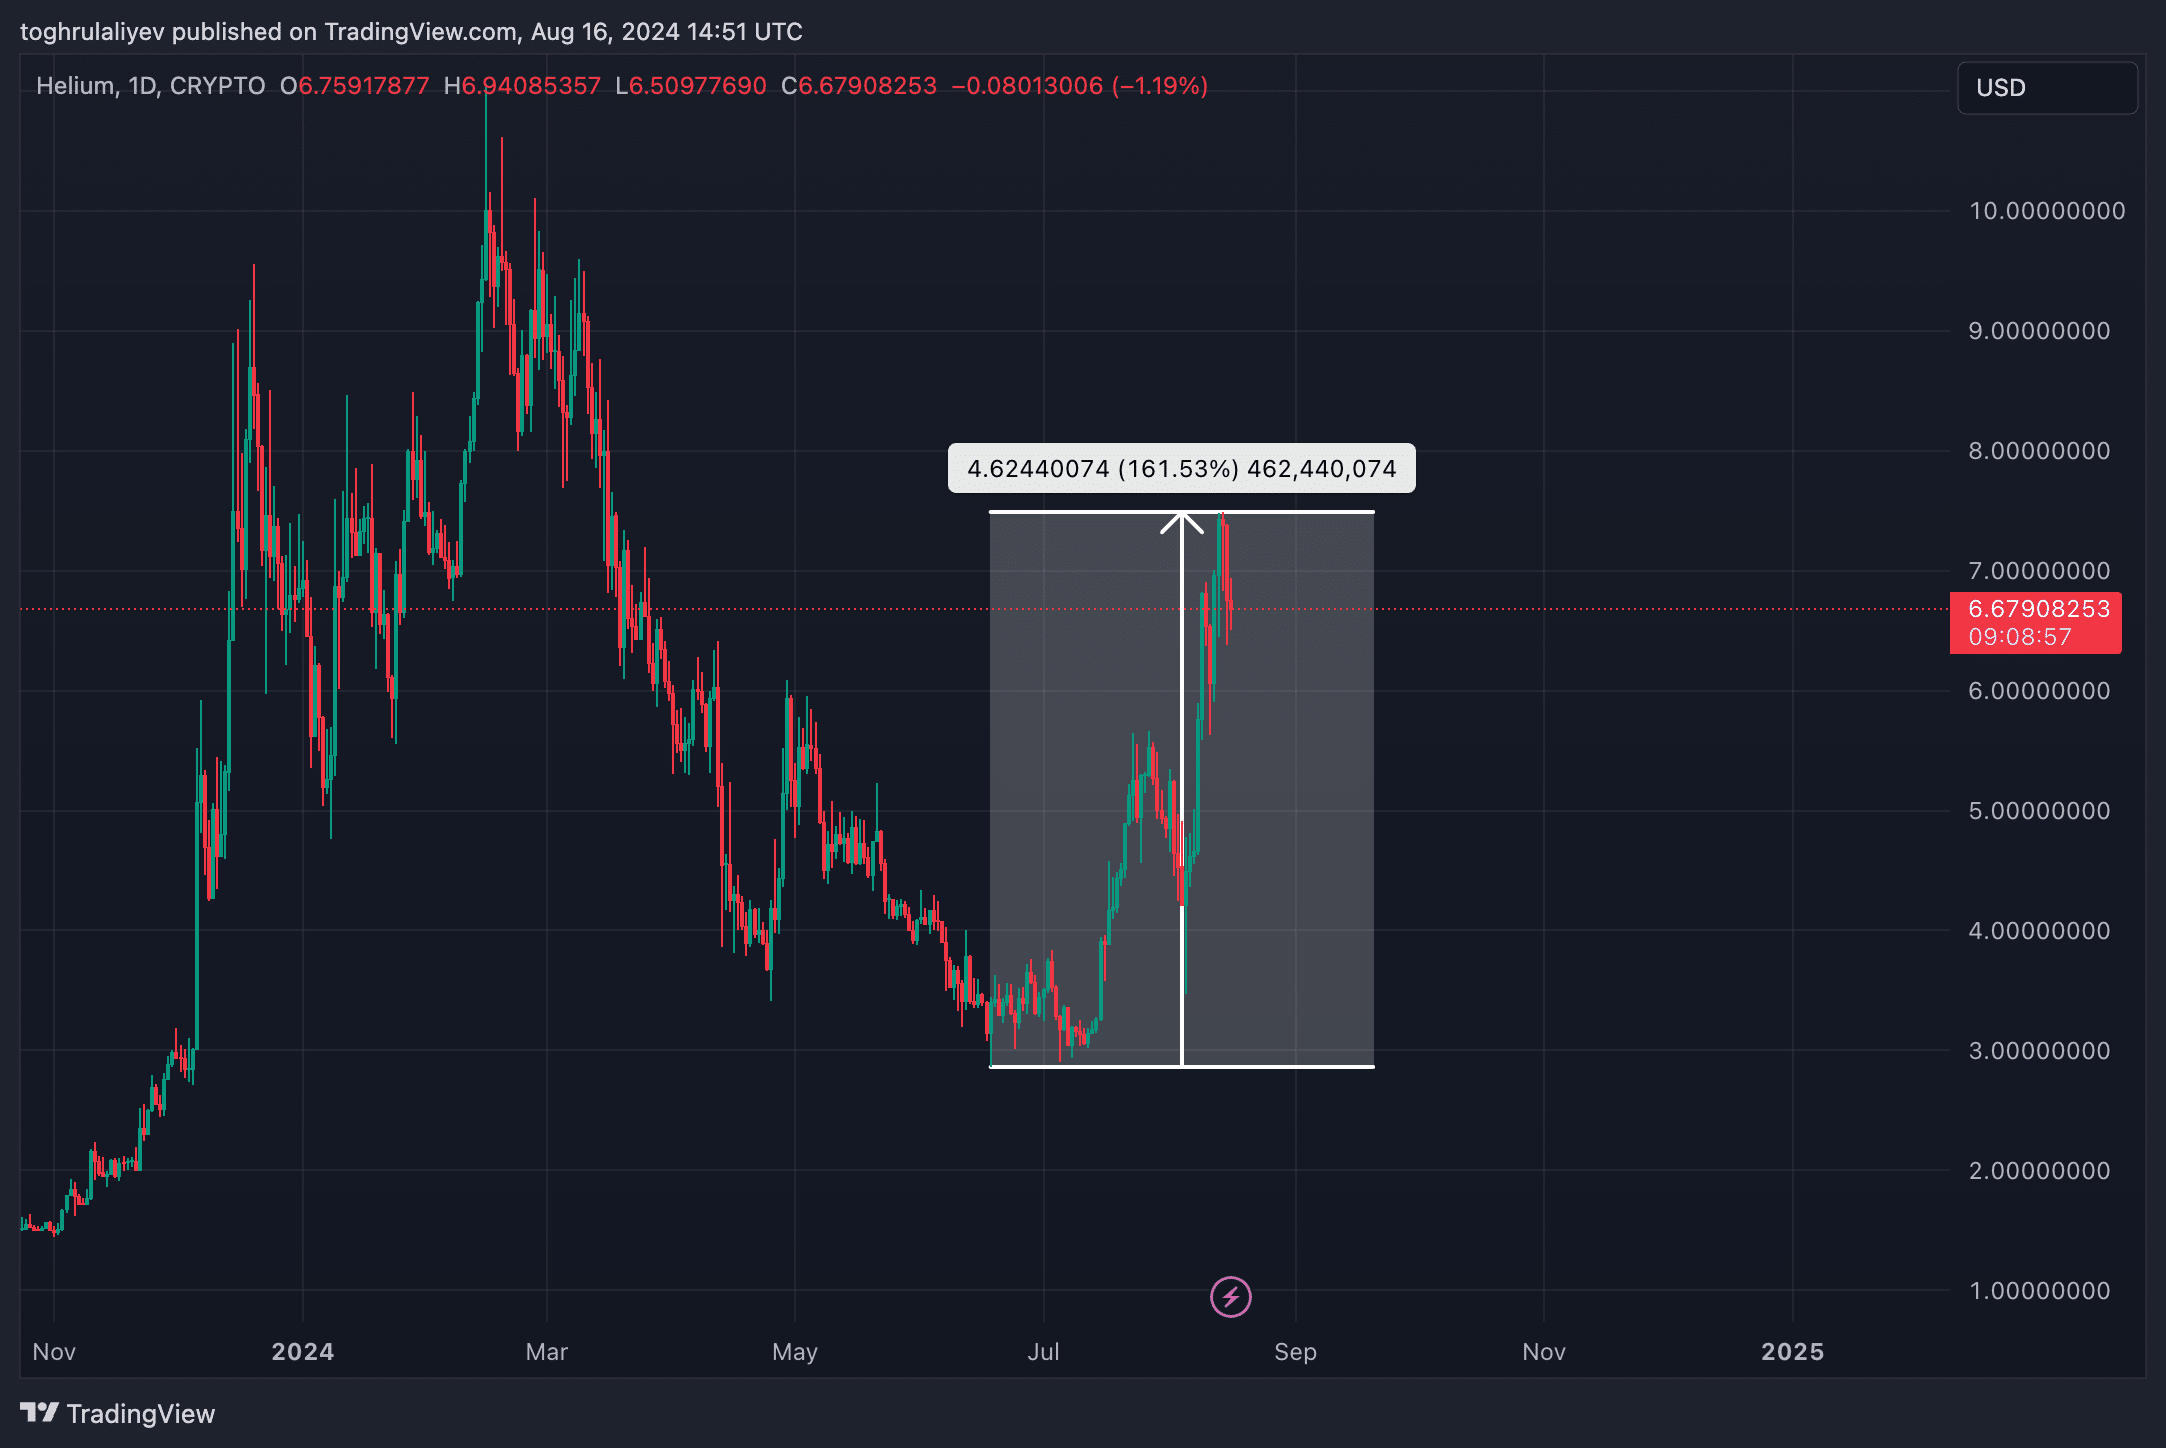
Helium (HNT) has gained 158.15% since the beginning of July, showing a strong upward trend. The key question now is whether HNT will continue its climb or if there will be a pullback on the horizon.
Table of Contents
While Helium’s (HNT) bullish run has been exciting, it may soon turn into a disappointment for investors. The lack of consolidation or pullback during this rally raises concerns that one might be on the horizon. Here’s why a pullback could be imminent.
Moving Average Convergence Divergence
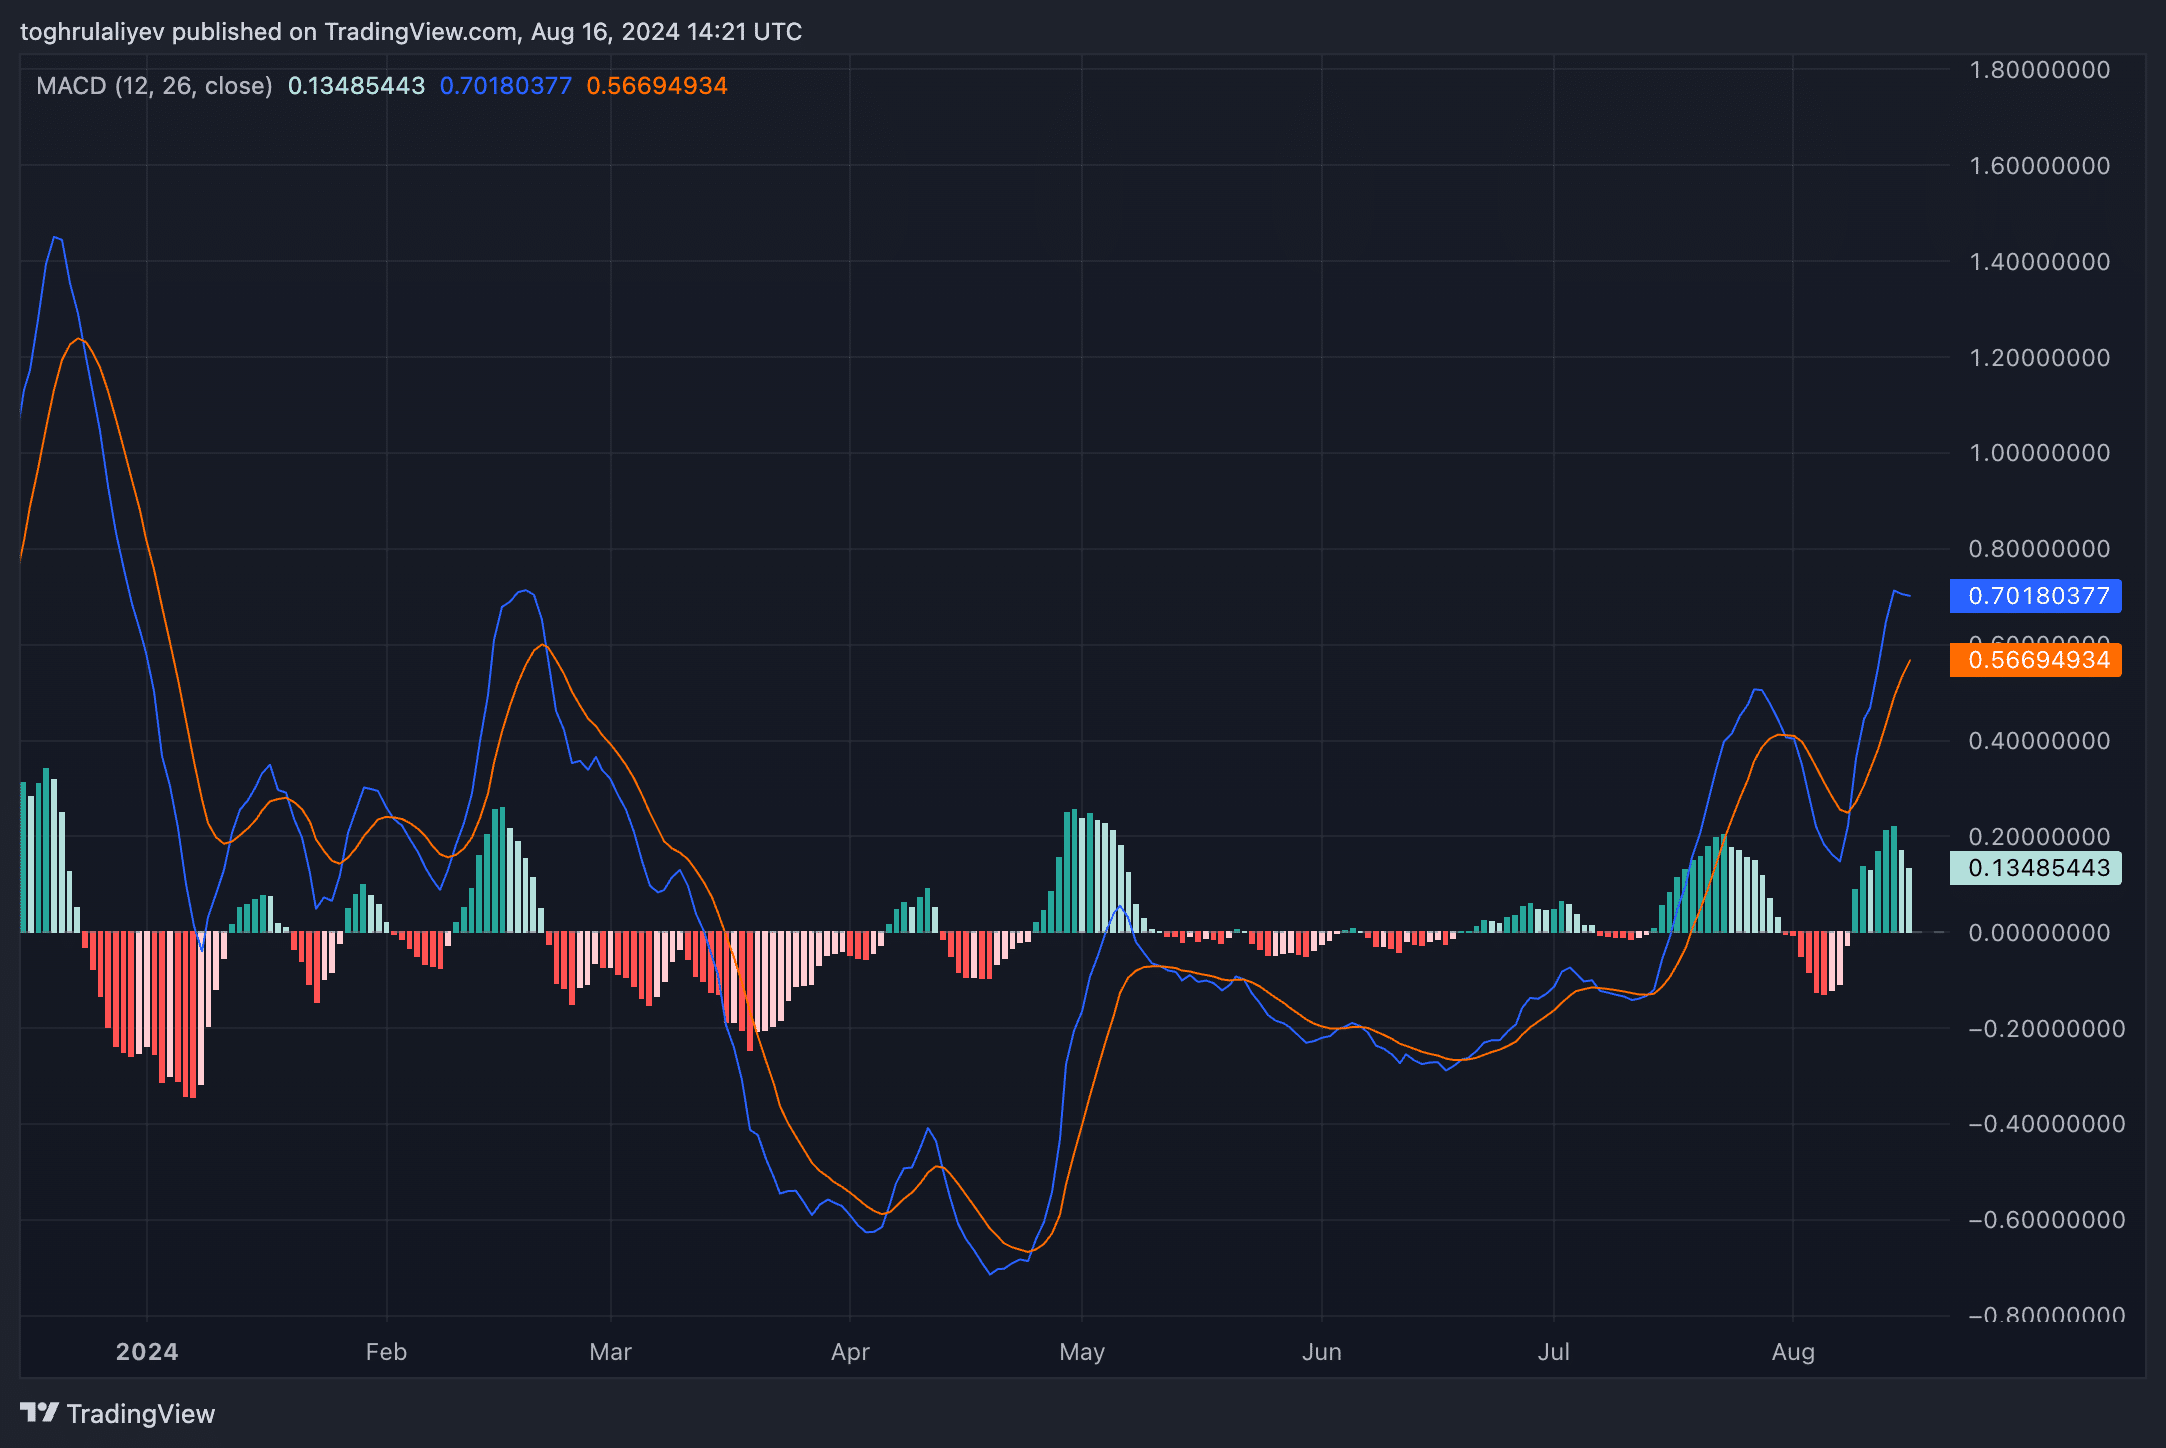
Examining the daily Moving Average Convergence Divergence (MACD), we notice the histogram shifting from dark green to light green, indicating a weakening bullish momentum. The MACD lines are also beginning to converge, suggesting that the current uptrend may be losing steam. A potential bearish crossover could signal a reversal in trend.
RSI and Stochastic RSI
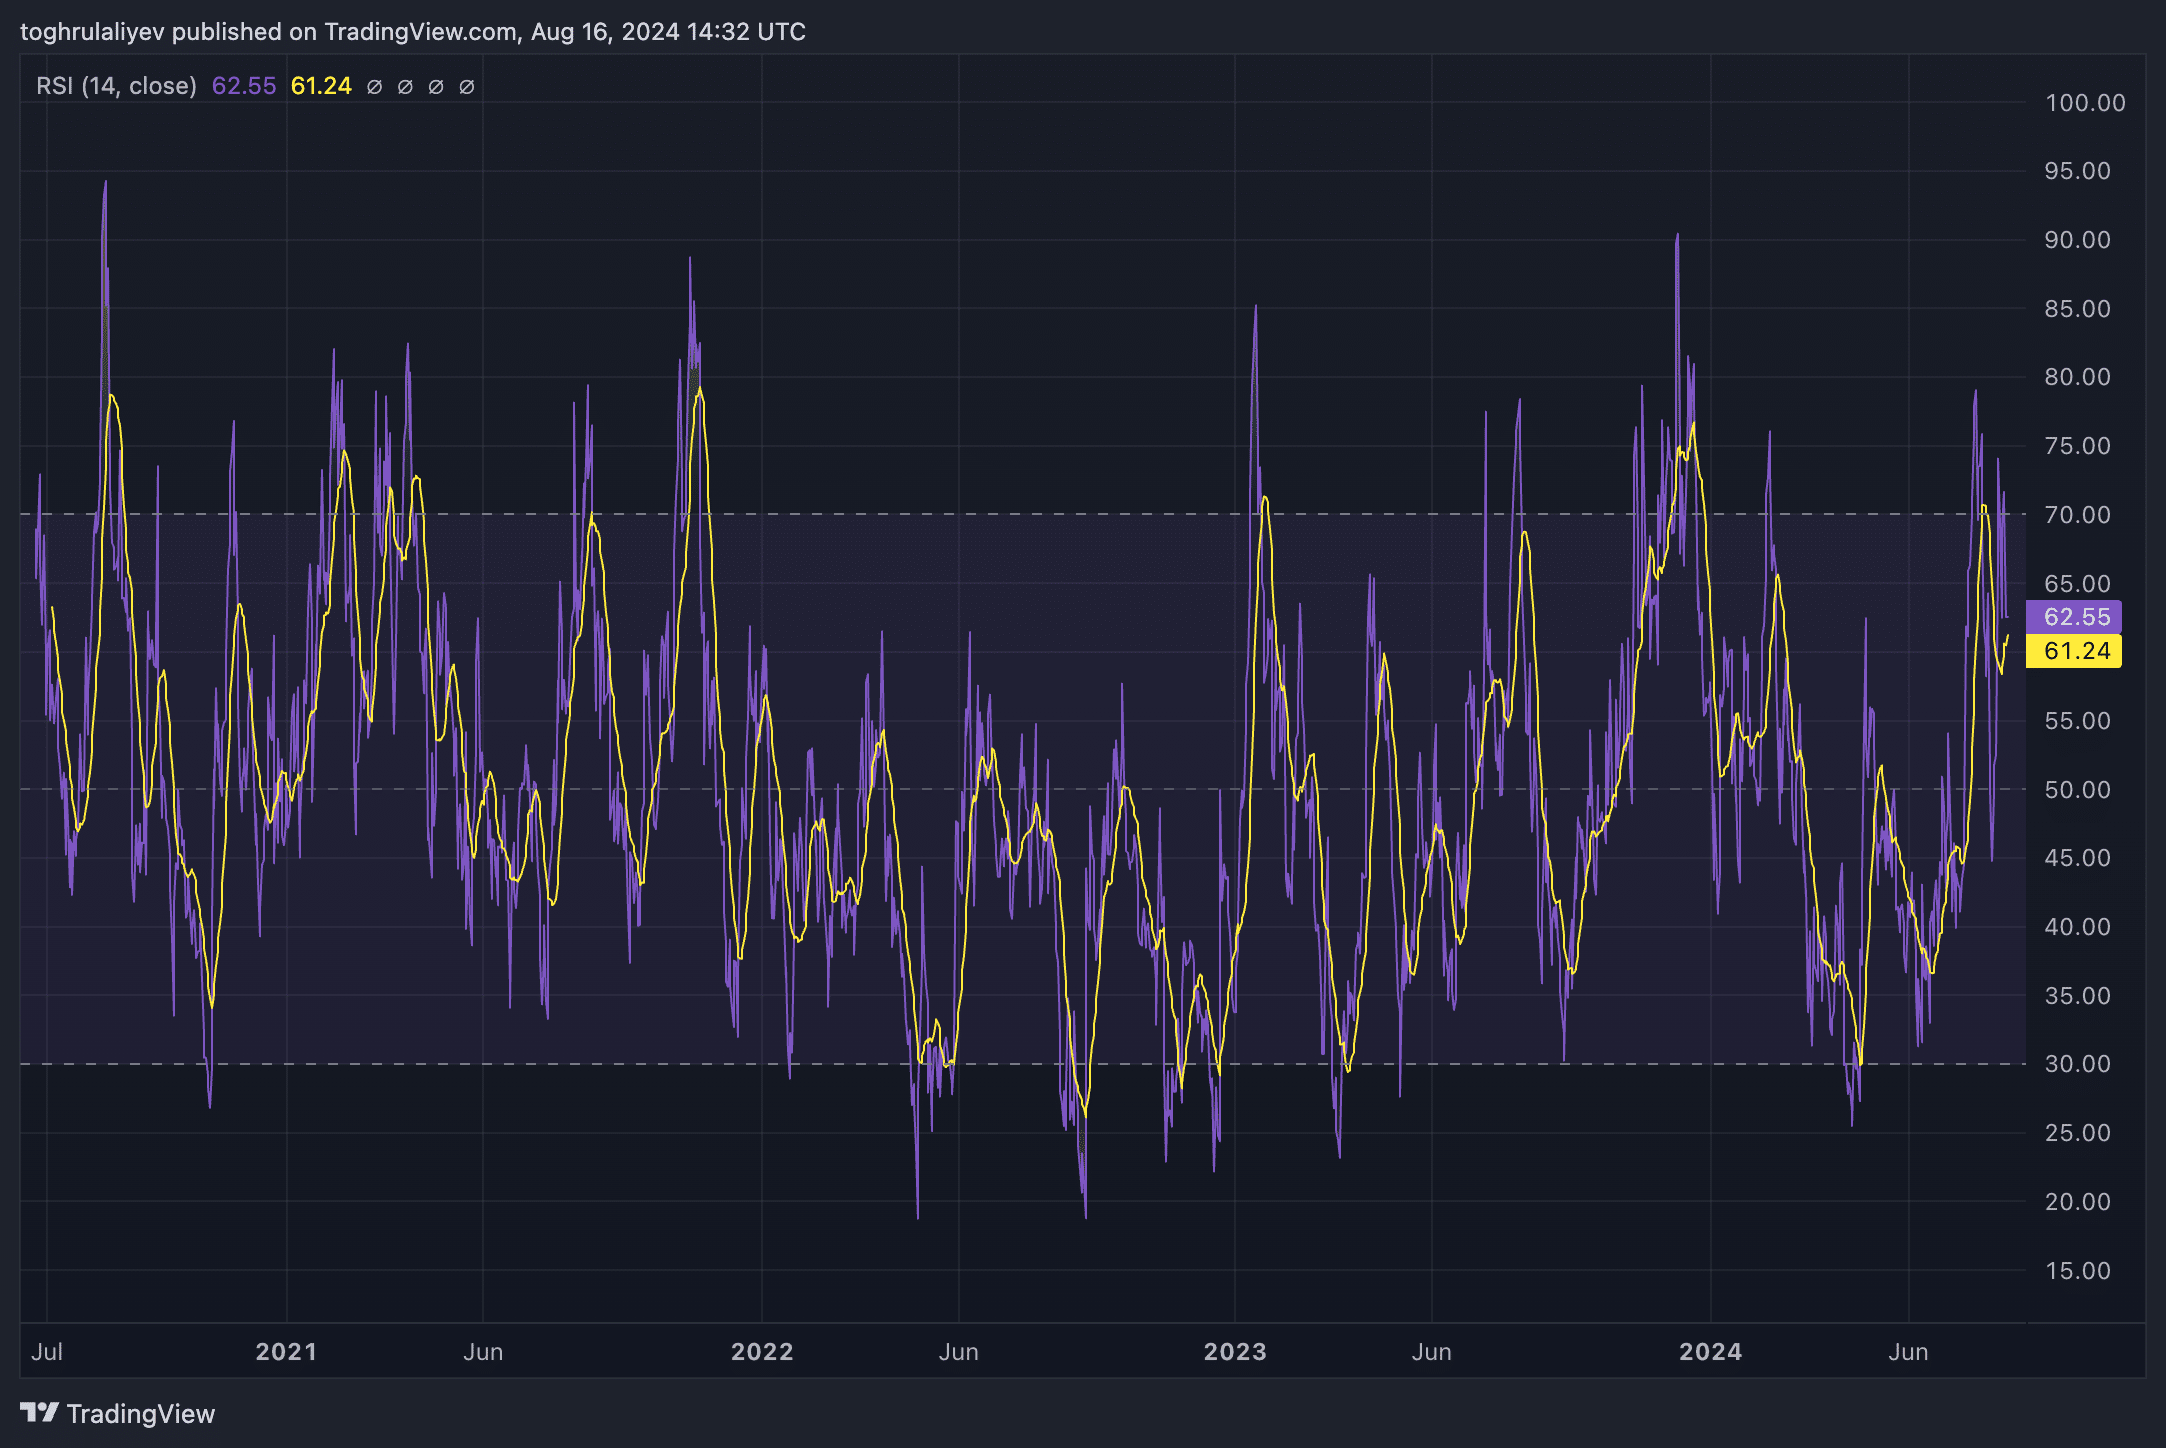
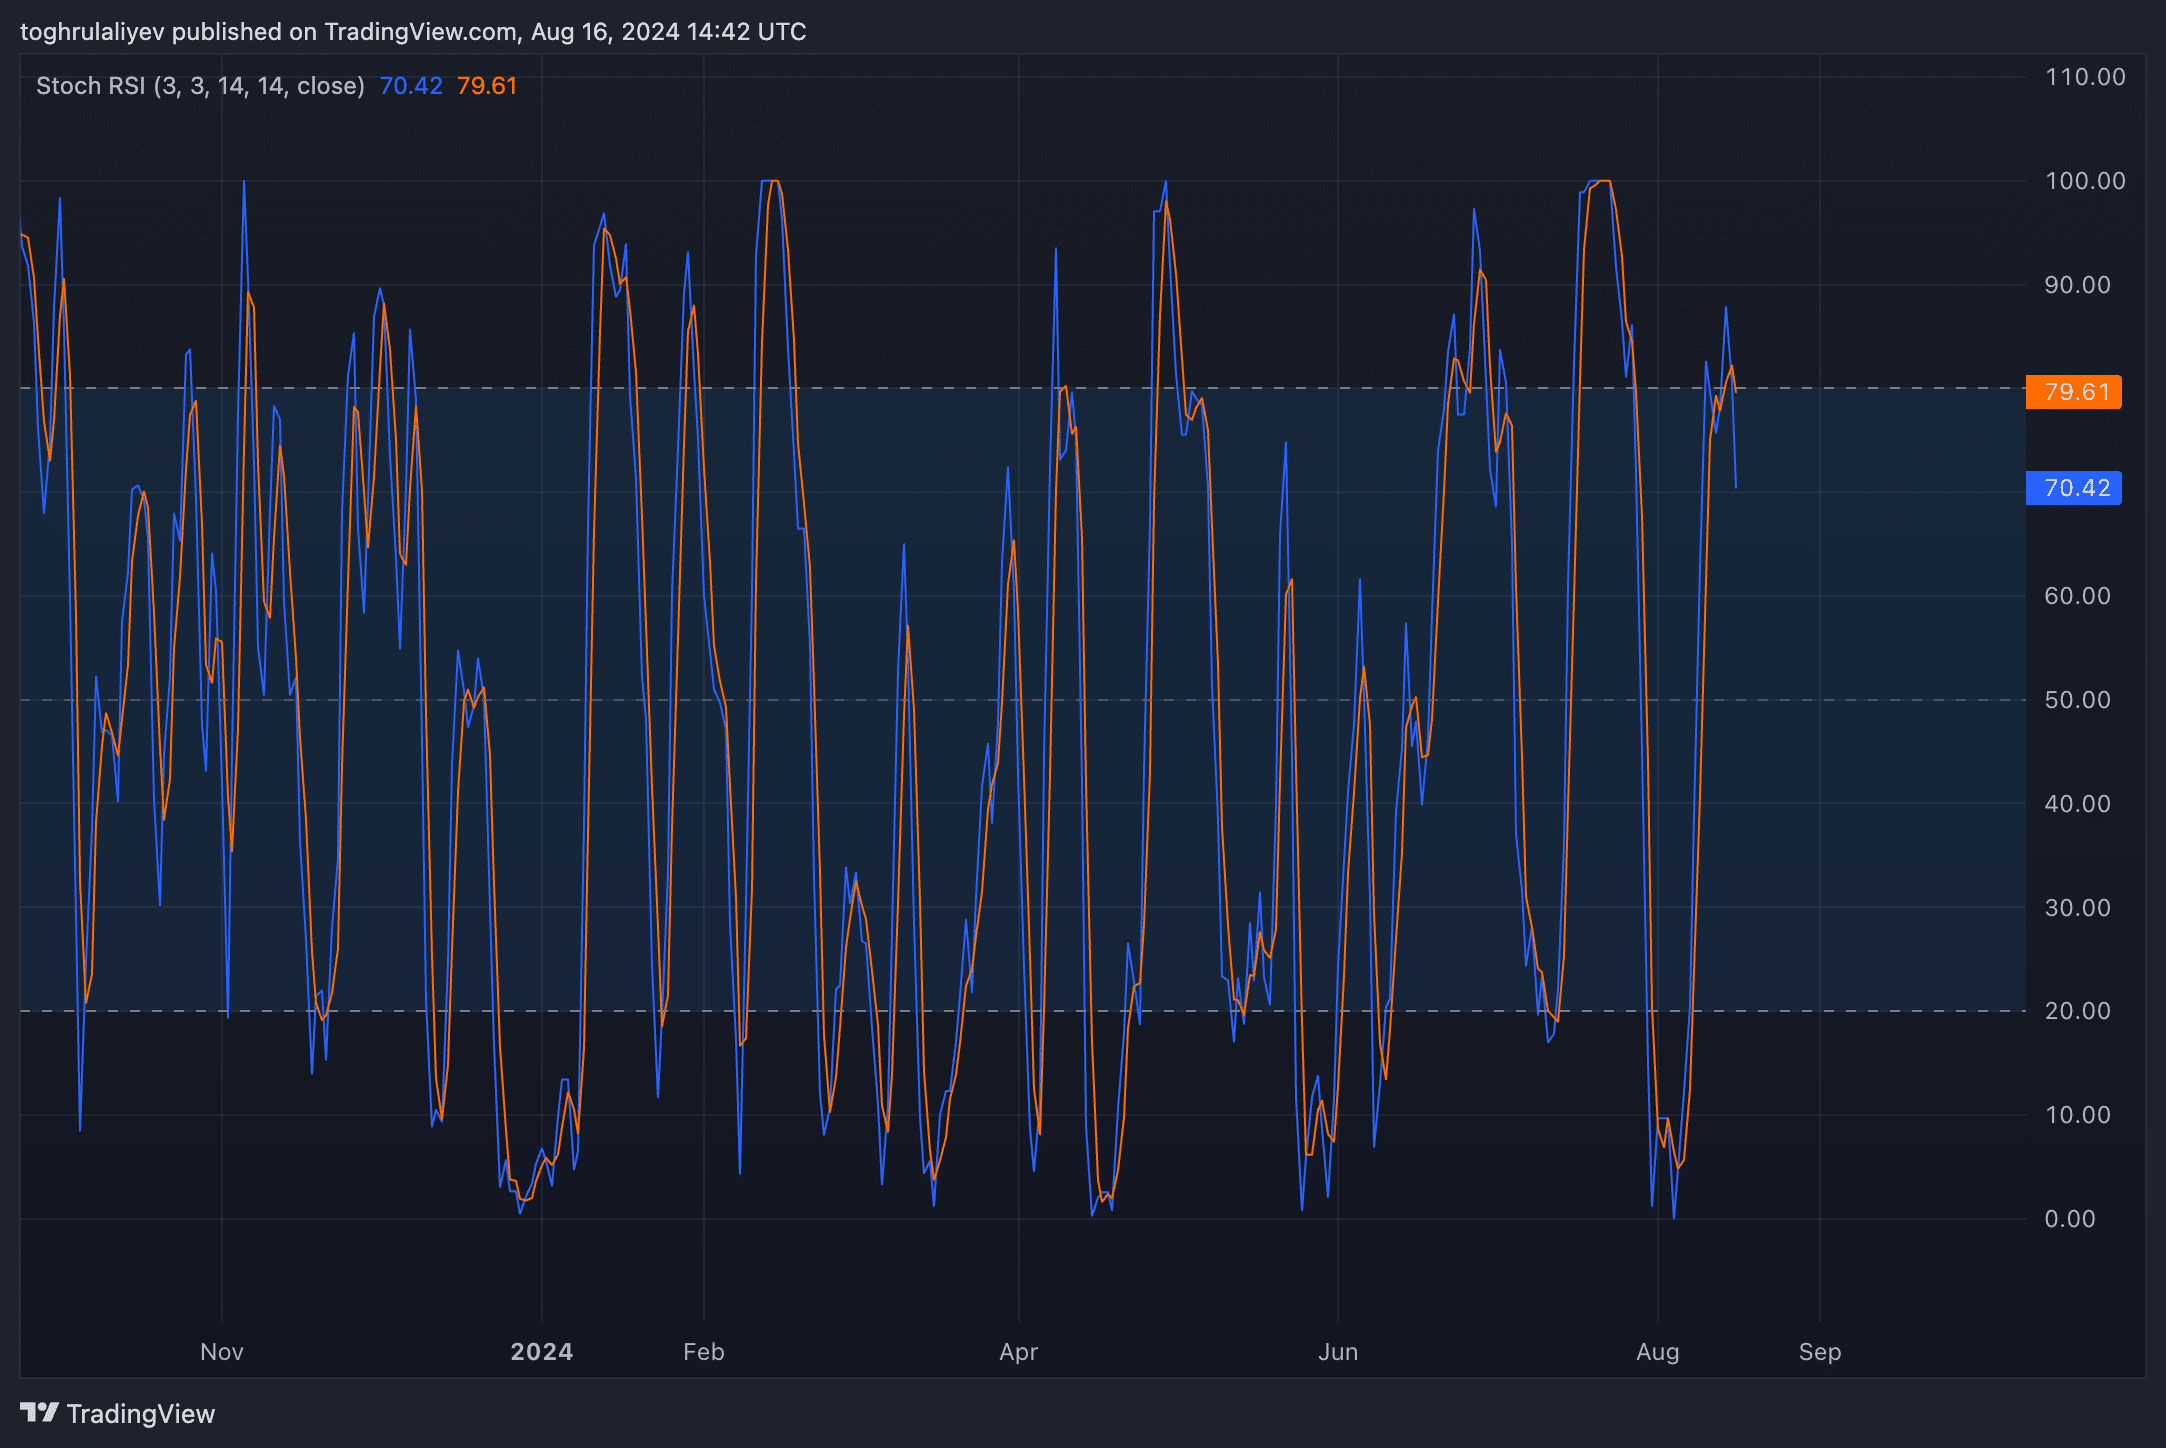
Both the Relative Strength Index (RSI) and Stochastic RSI are in overvalued territory, with readings above 60. Historically, when RSI and Stochastic RSI have reached 60+ levels, they tend to retreat significantly, often accompanied by a sharp price decline.
Support and resistance levels
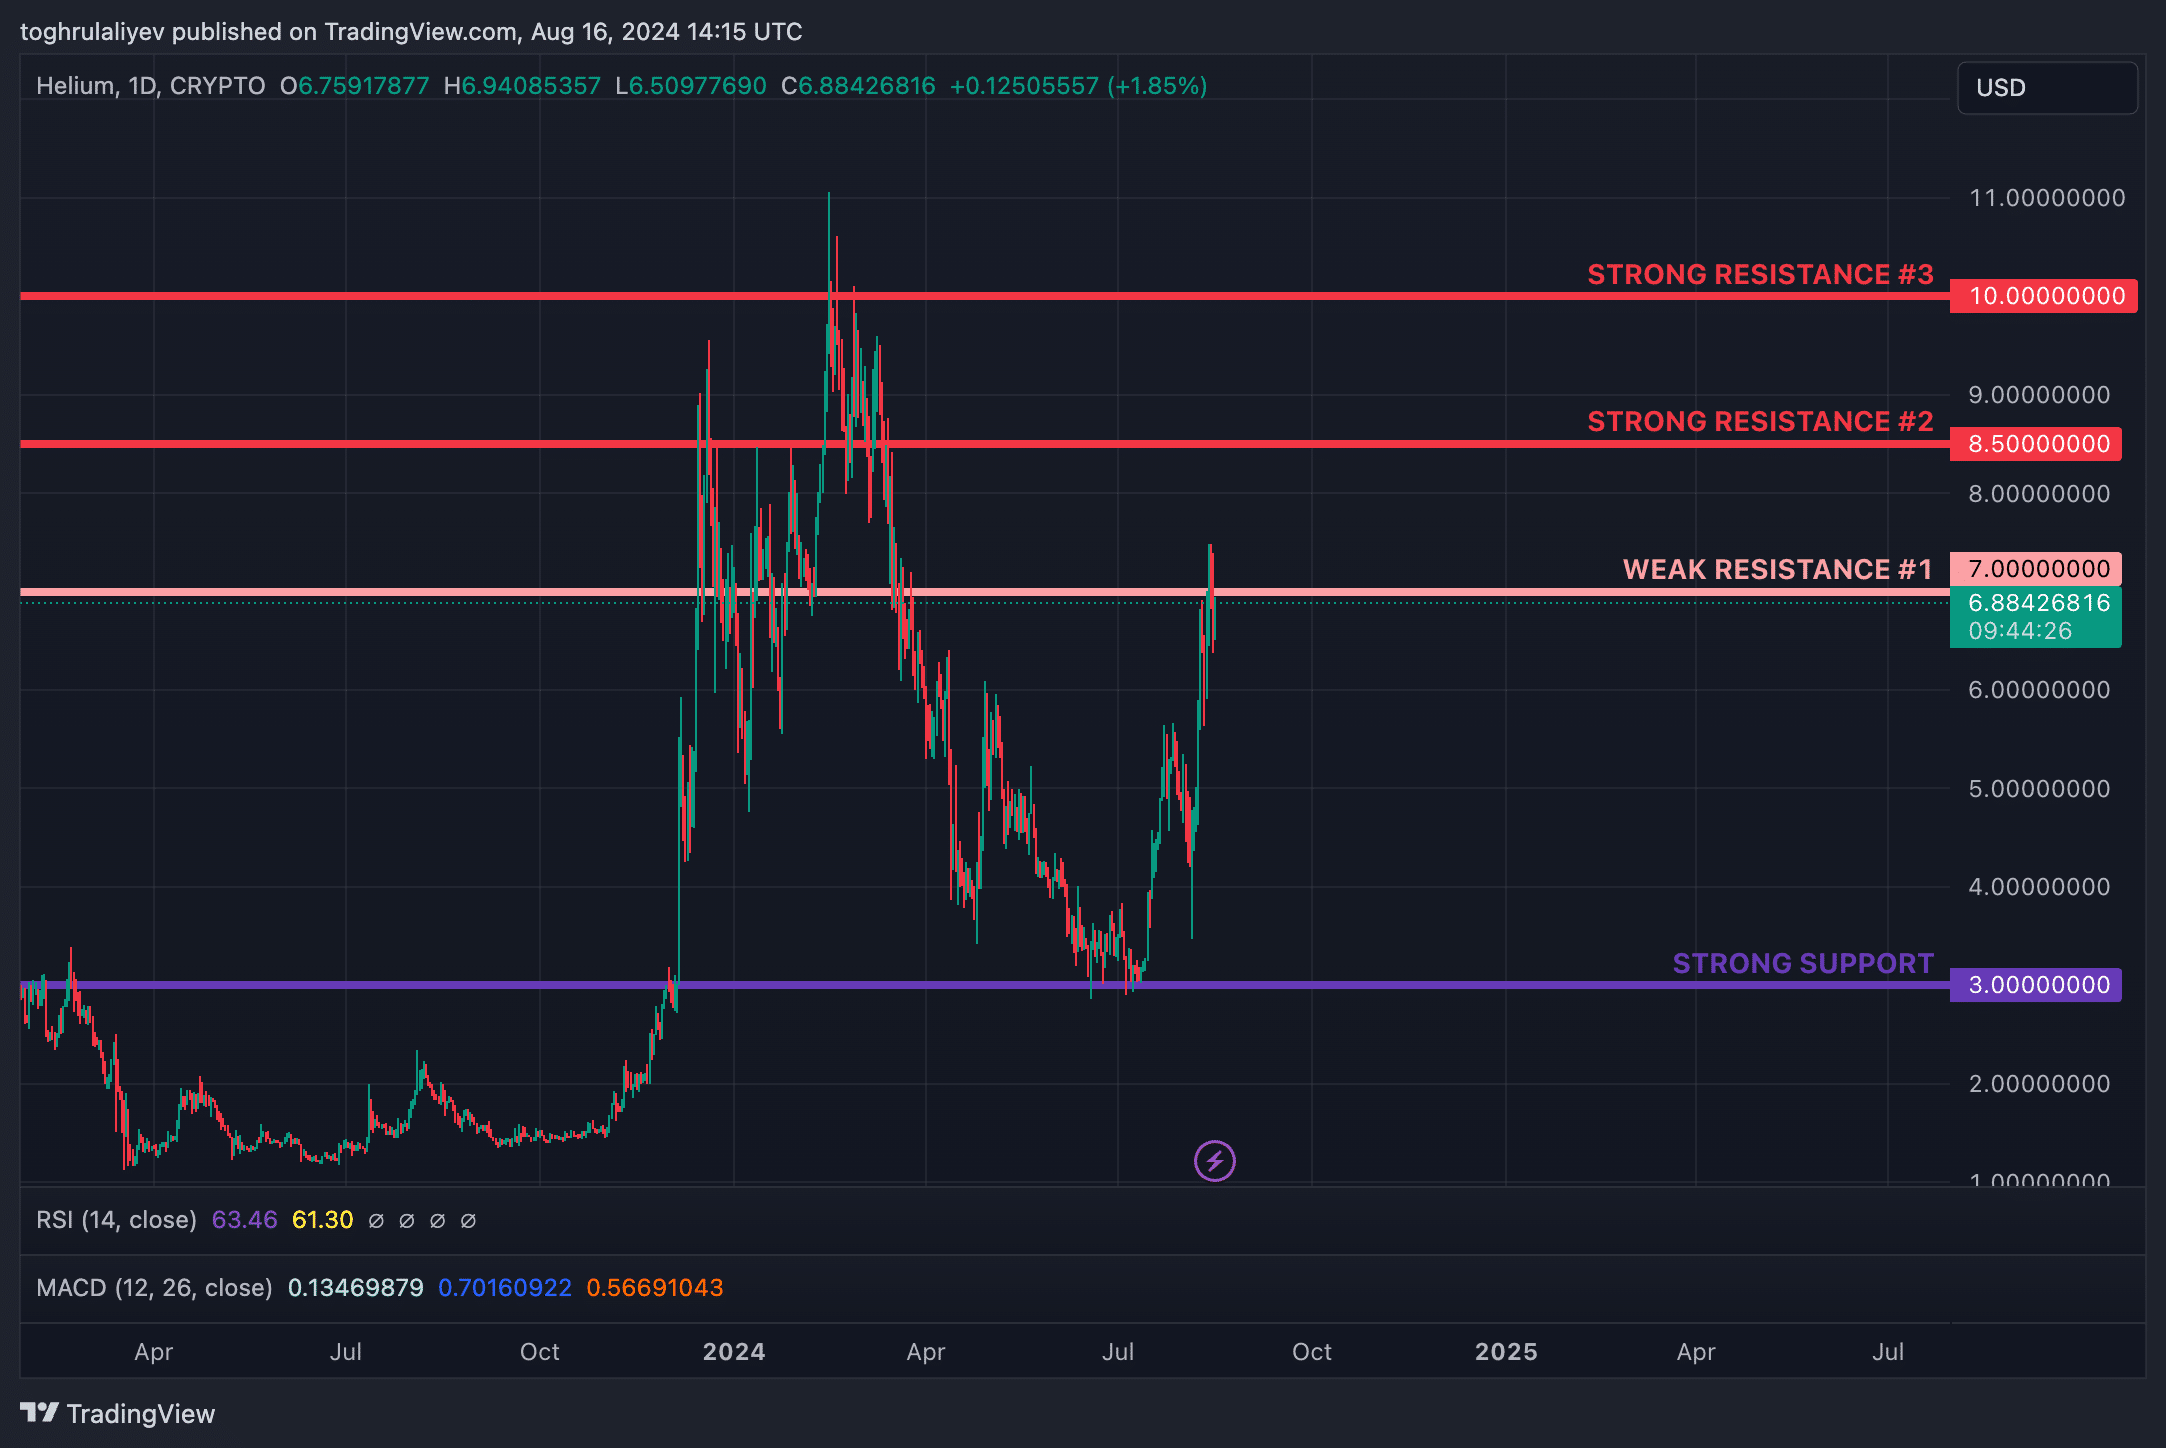
The current price action shows strong resistance levels at $8.5 and $10. These levels have proven difficult to surpass or acted as strong support levels in the past. Meanwhile, the $7 level serves as a weak area. Currently, it has acted as resistance, but its role could change if HNT breaks above it. If the price fails to break through $7, a more pronounced downtrend is likely to begin.
Fibonacci confluence levels
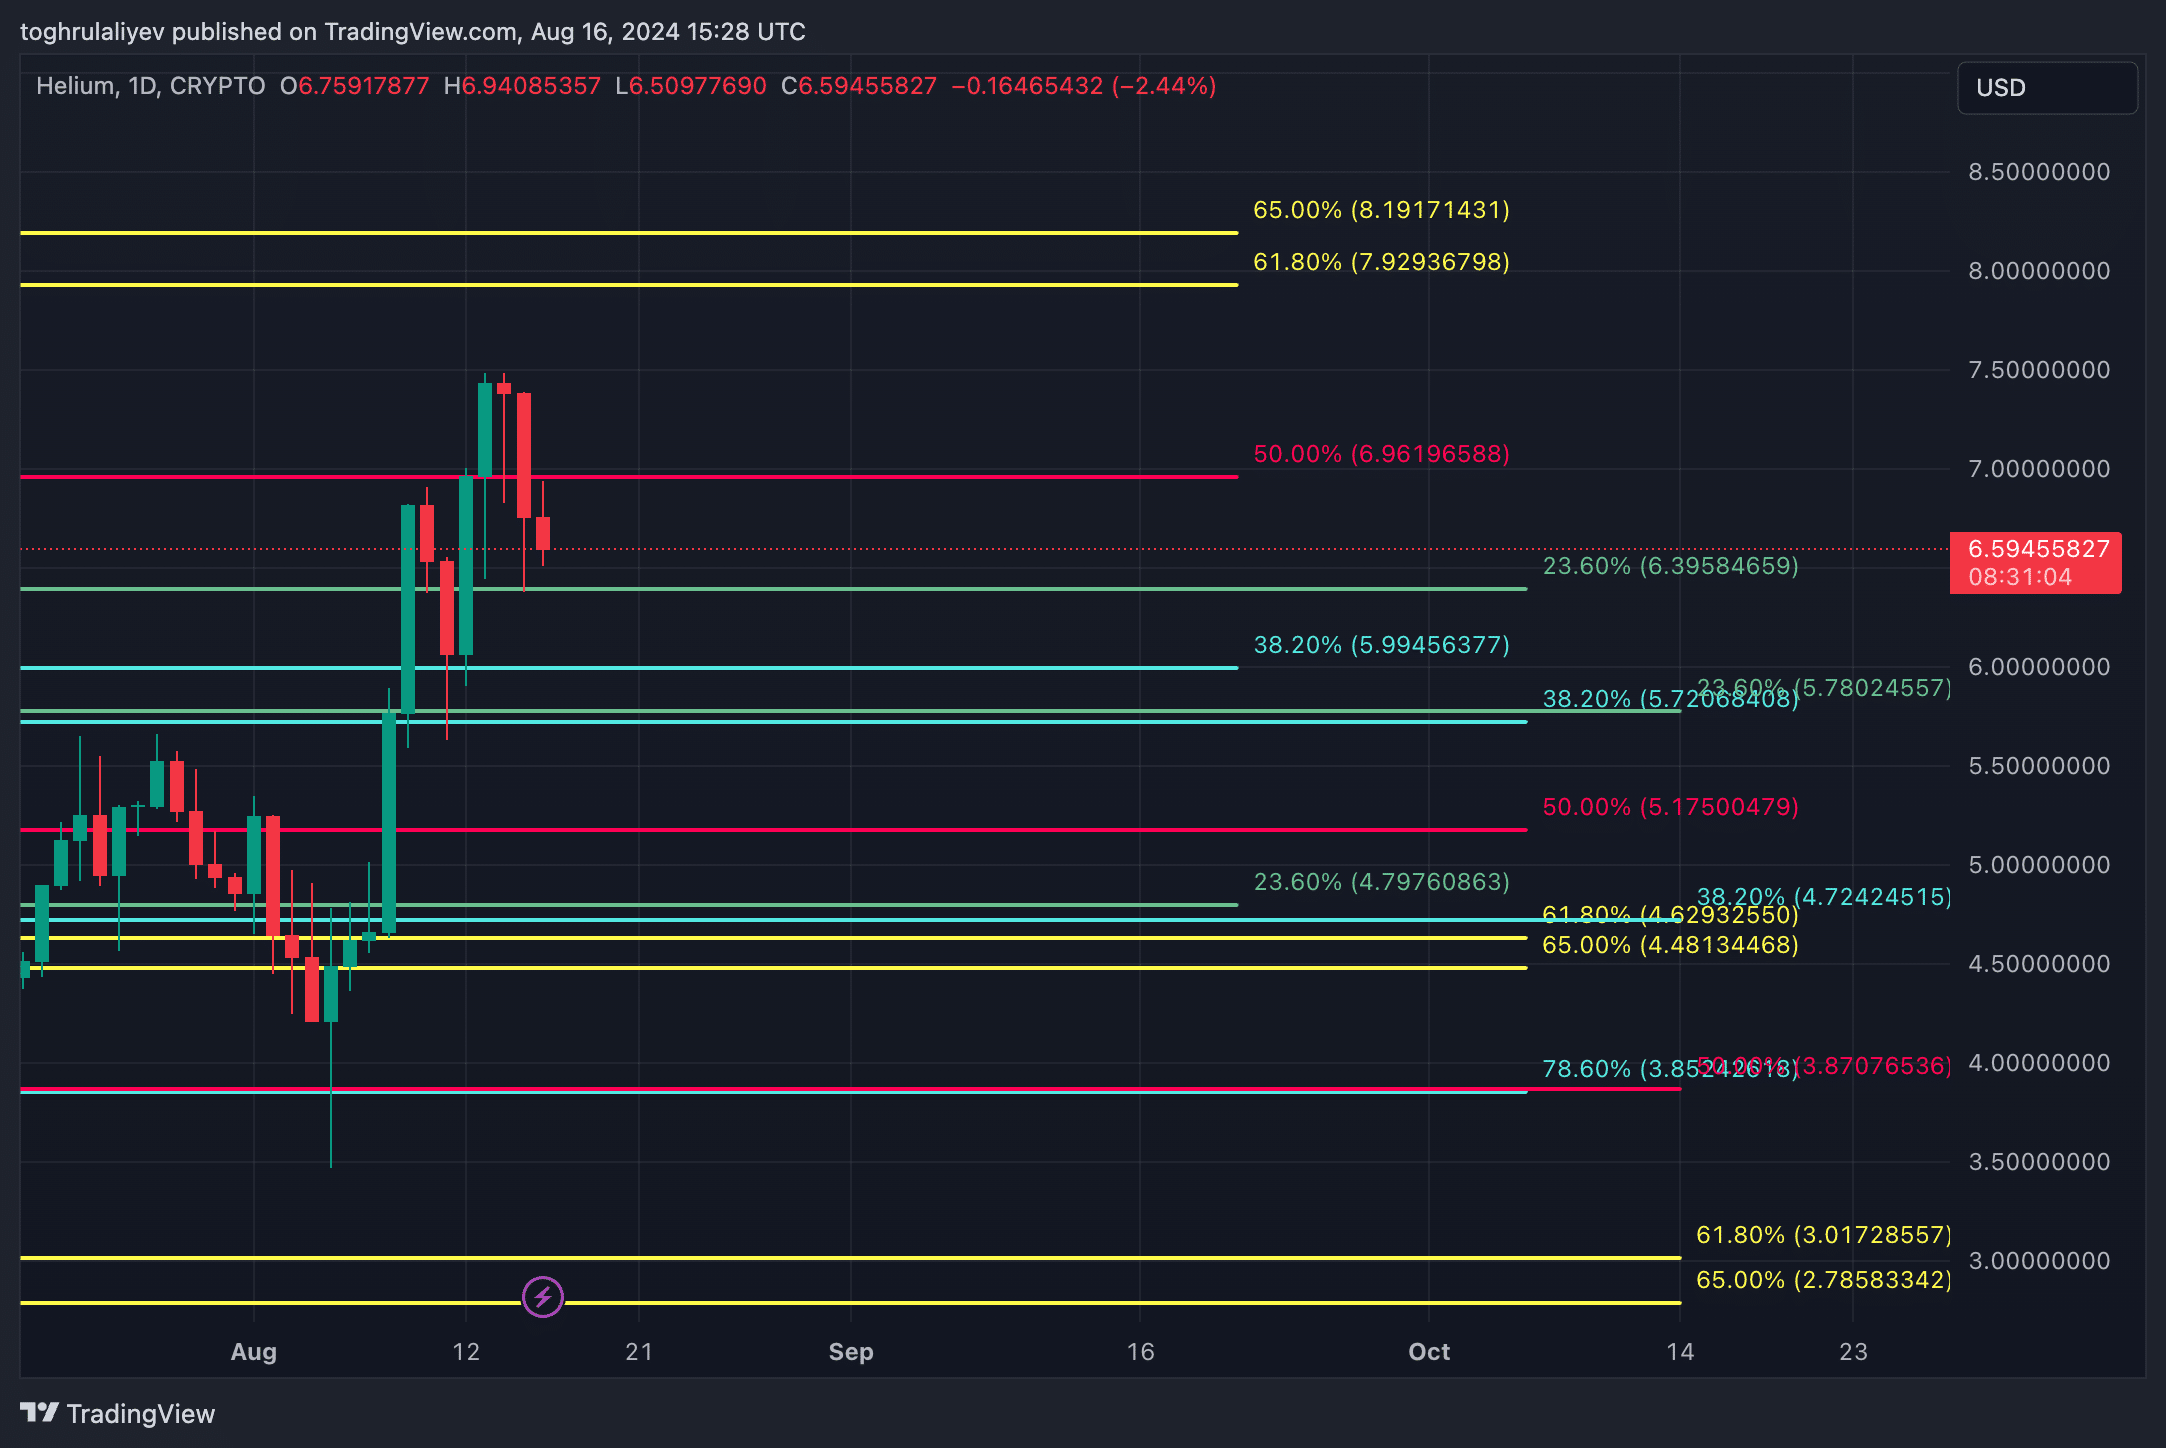
By applying Fibonacci retracement levels from three different time frames—the initial day of trading to the recent high, the low of June to the recent high, and the high of March to the low of June—we identify multiple confluence levels. These confluence levels are clustered around $6 and $4.7.
The area between $4.7 and $6 forms what we refer to as a “box of opportunity.” This range presents a potential target zone for a short position, with the expectation that HNT could retrace this area if the downtrend continues.
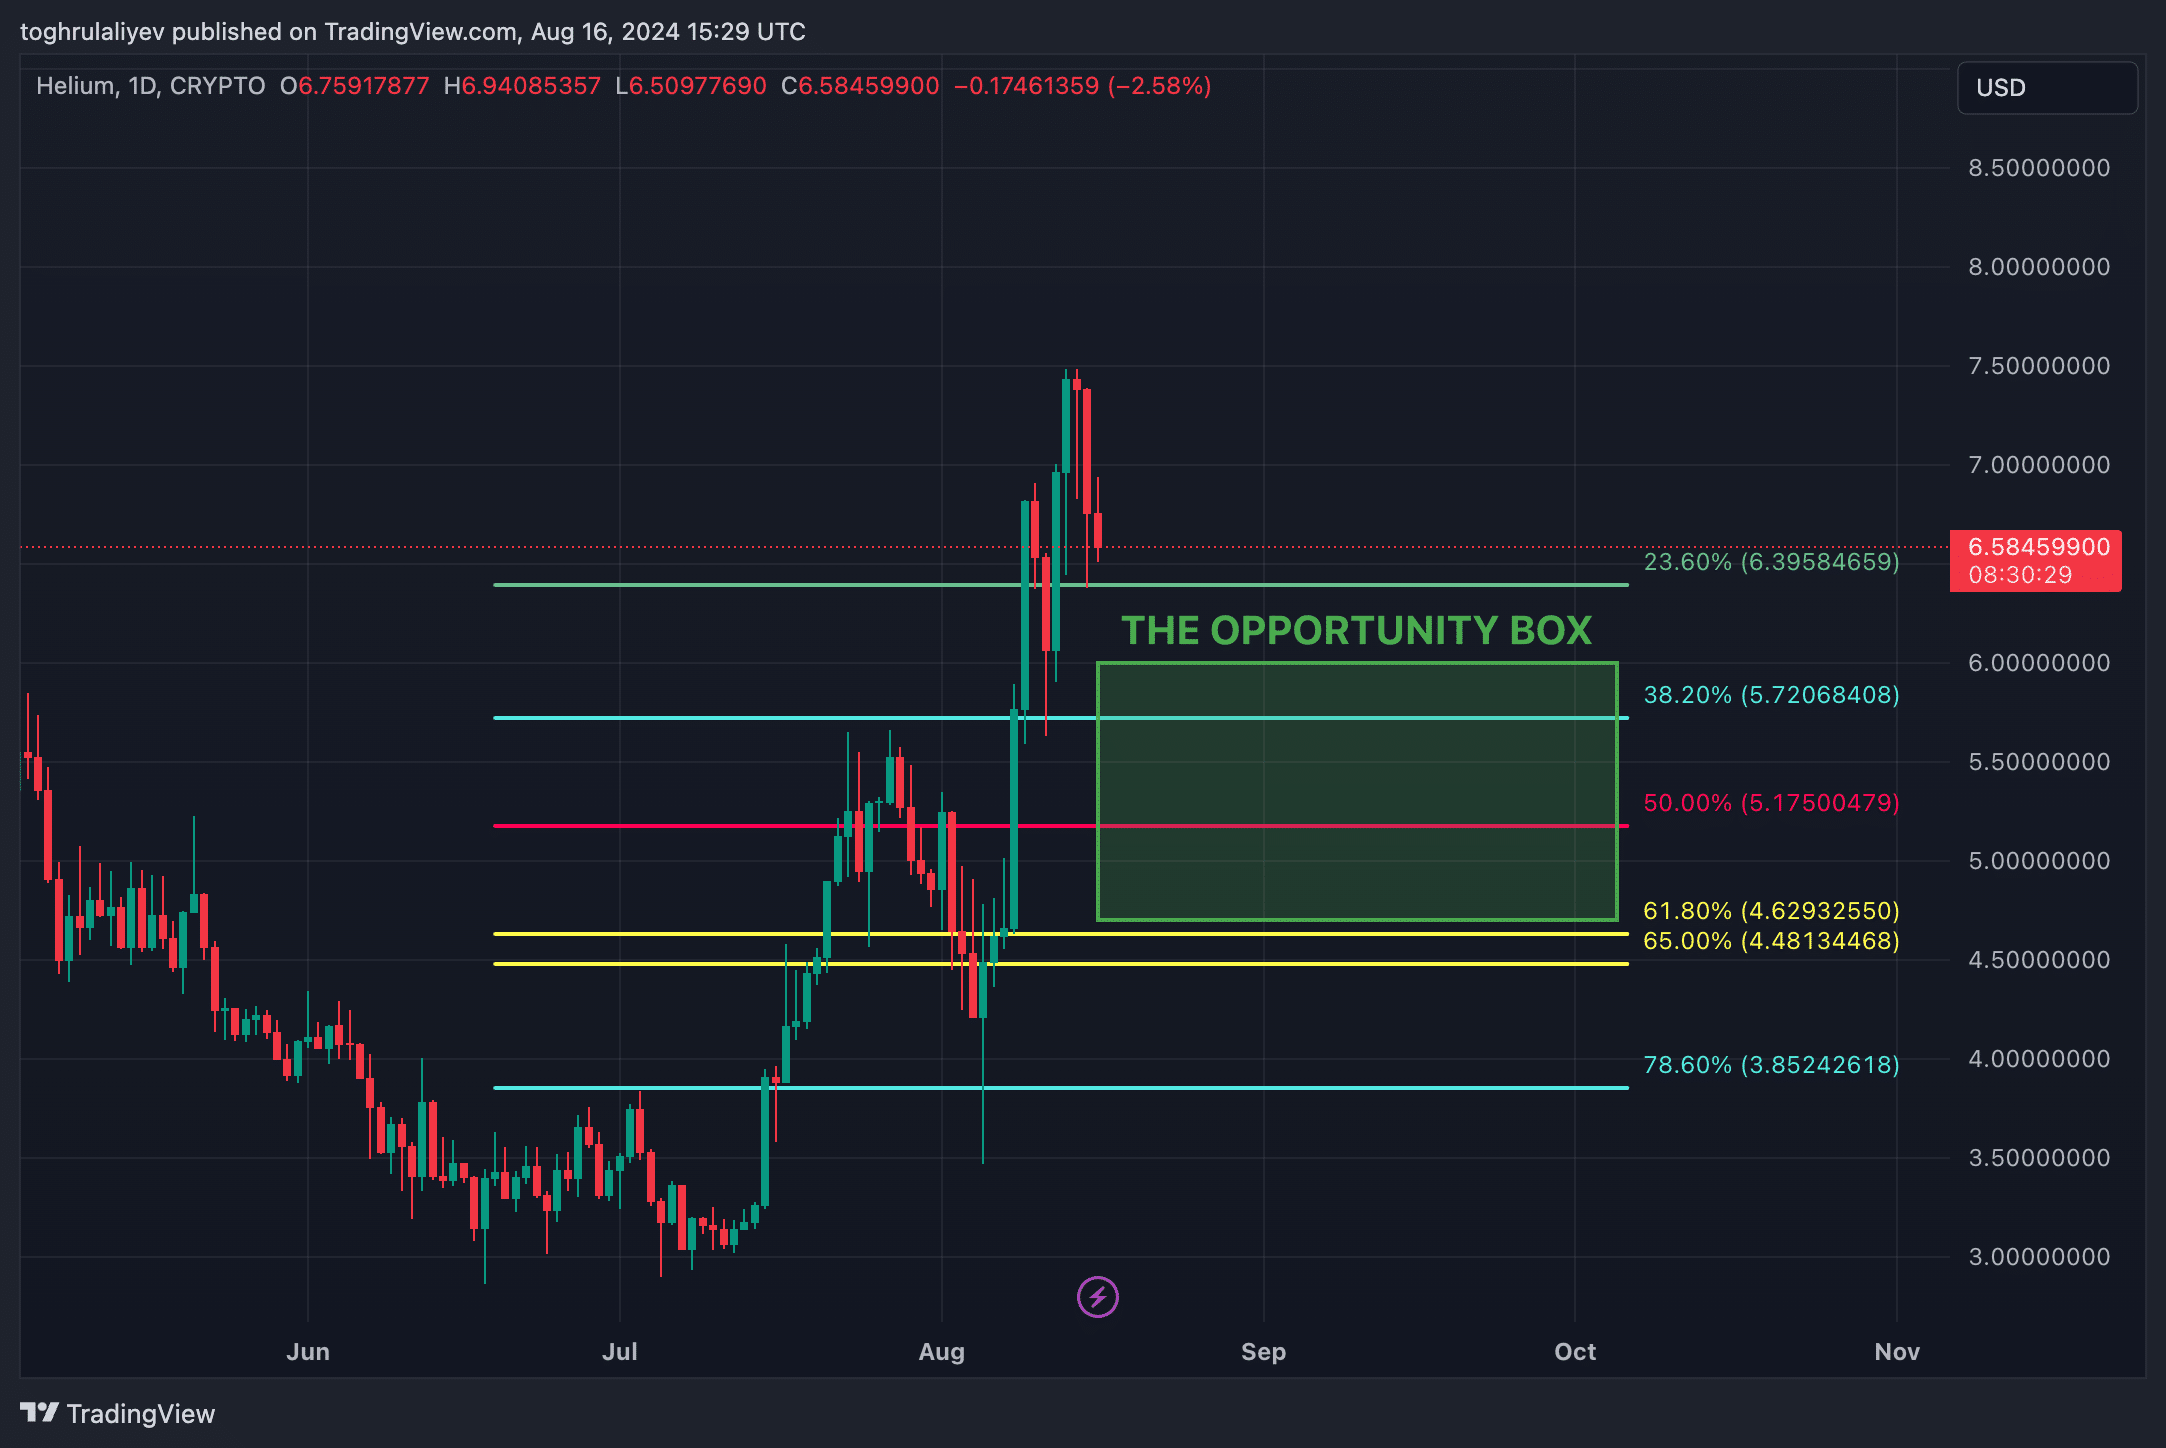
Historical support lies at $3, but a drop to this level seems unlikely unless significant negative events occur in the broader market, similar to what happened with Japan’s surprise rate hike and Jump Trading’s selling spree in late July and early August.
Strategic Considerations
Before initiating a short position, it’s important to confirm the downtrend. Although the trend has recently shifted, there’s always the possibility of a bear trap. To minimize risk, we recommend waiting for HNT to fall below $6.3958, which is the 23.6% Fibonacci retracement from the June low to the August high. Once HNT breaks below this level, and it acts as resistance, the shorting opportunity becomes much safer.
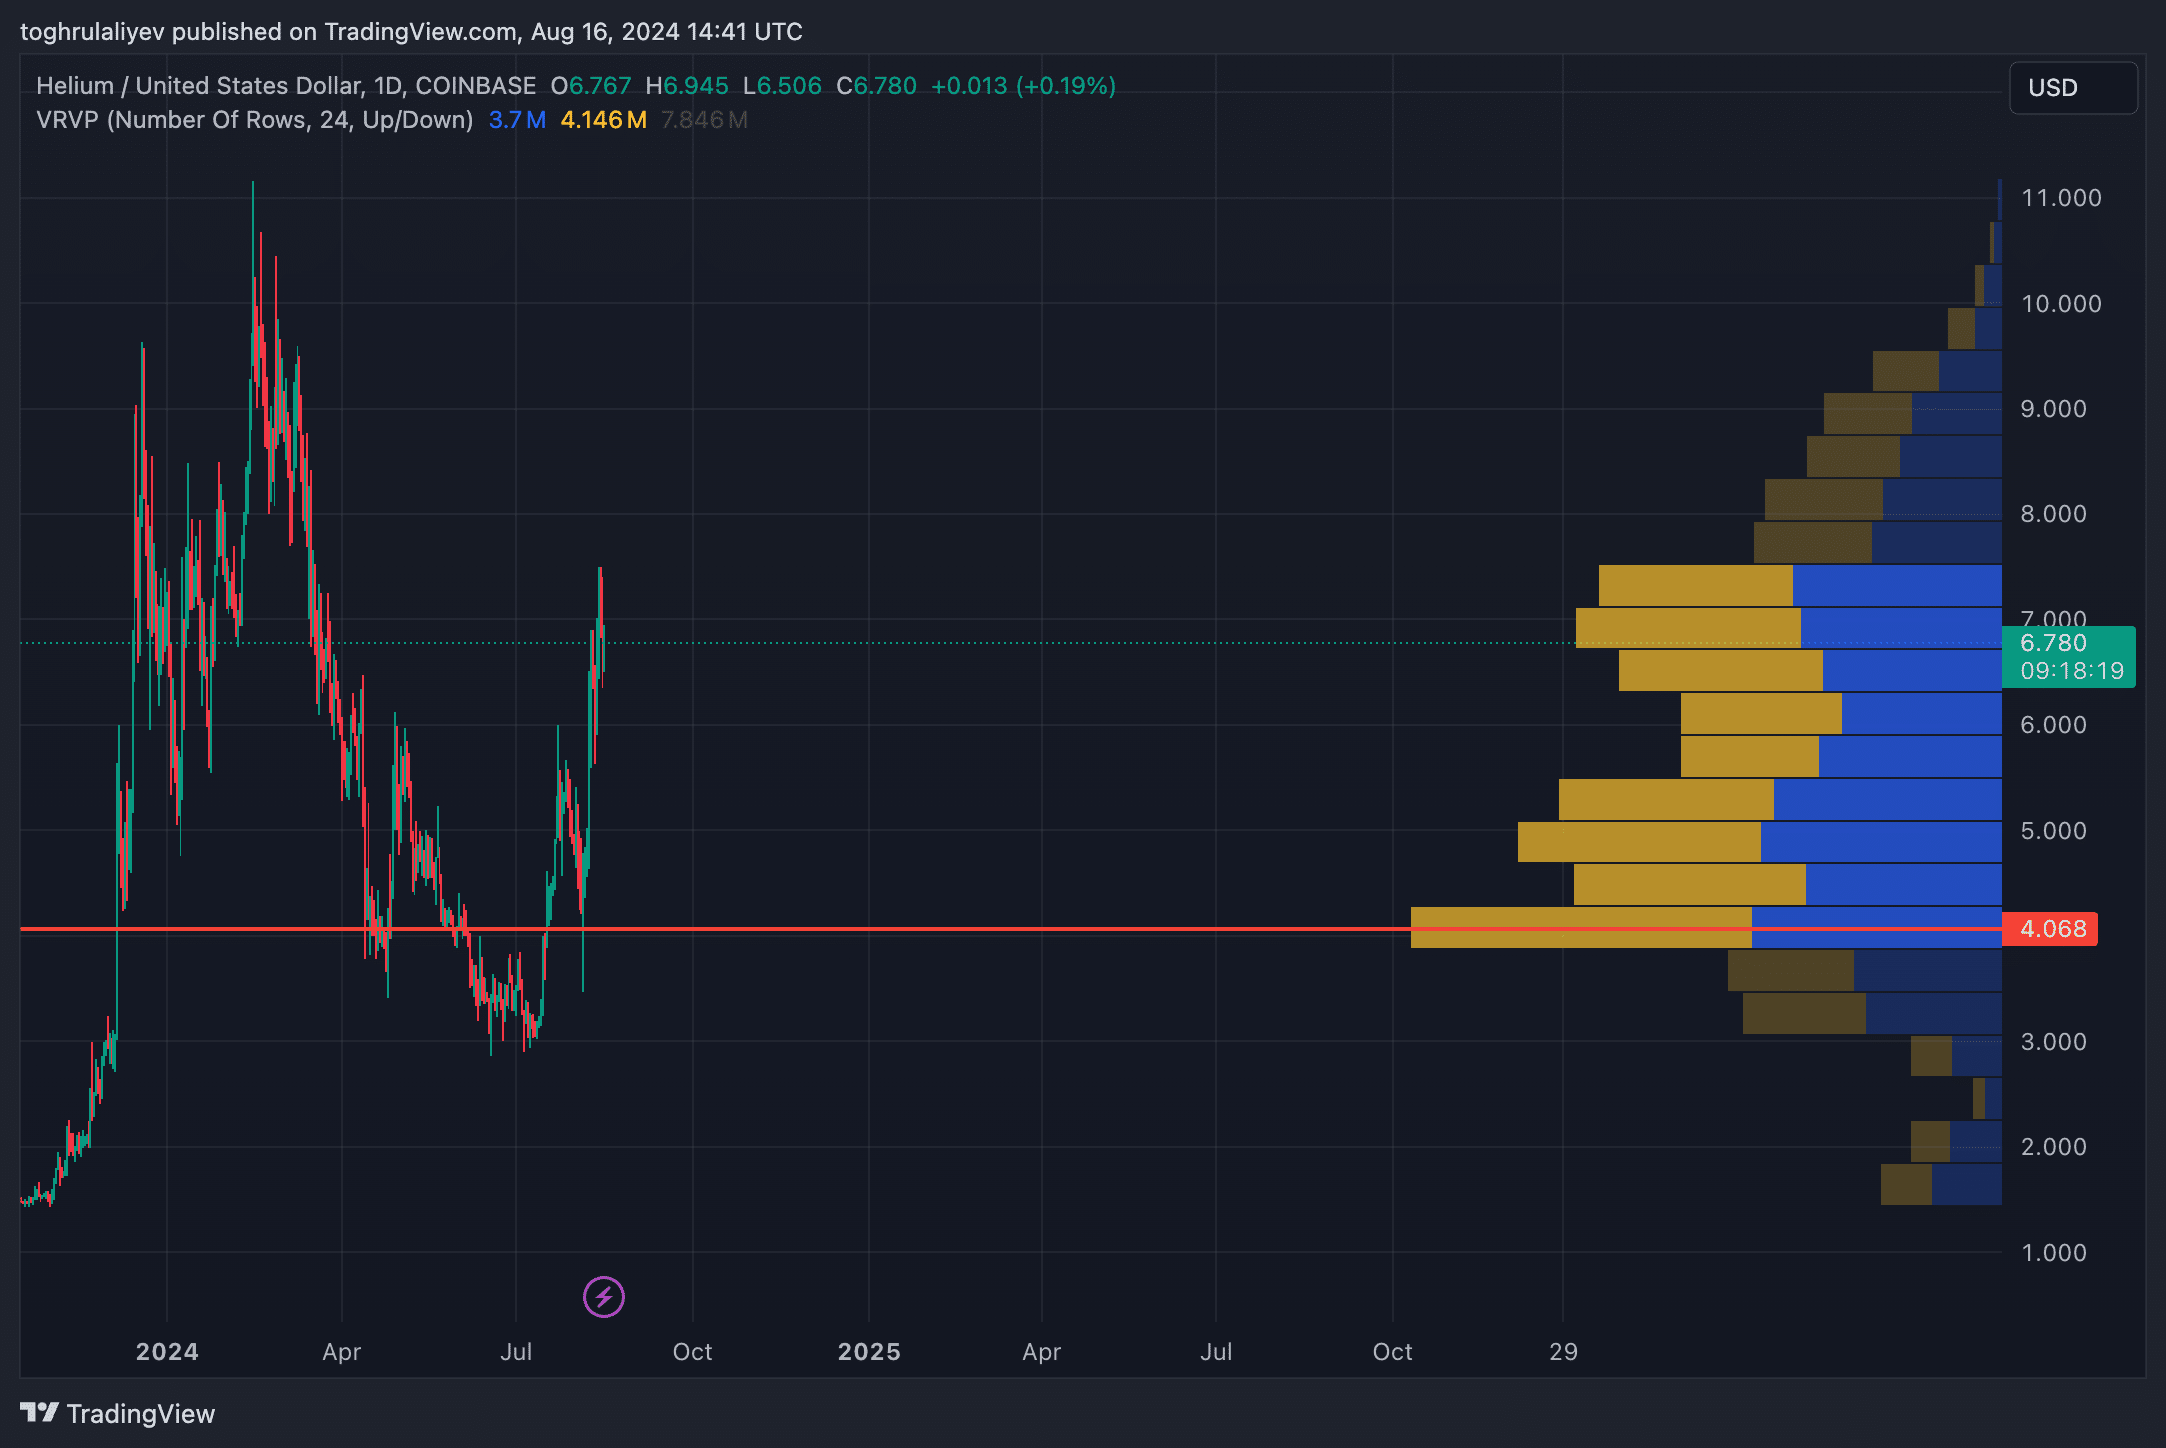
Another factor to consider is the Visible Range Volume Profile, which shows a weak volume area between $5.5 and $6.5. Prices tend to move quickly through such low-volume zones, further supporting the likelihood of a downward move. However, currently, HNT is within a high-volume zone, which could potentially serve as a consolidation area.
Disclosure: This article does not represent investment advice. The content and materials featured on this page are for educational purposes only.