Chart of the week: Last Fed rate cut sent Cardano crashing 57% – what about now?

Cardano dropped 57% when the Federal Reserve cut rates back in 2019. With another rate cut on the horizon, the cryptocurrency faces a similar setup that could bring major downside.
Table of Contents
Cardano prepares for September decline
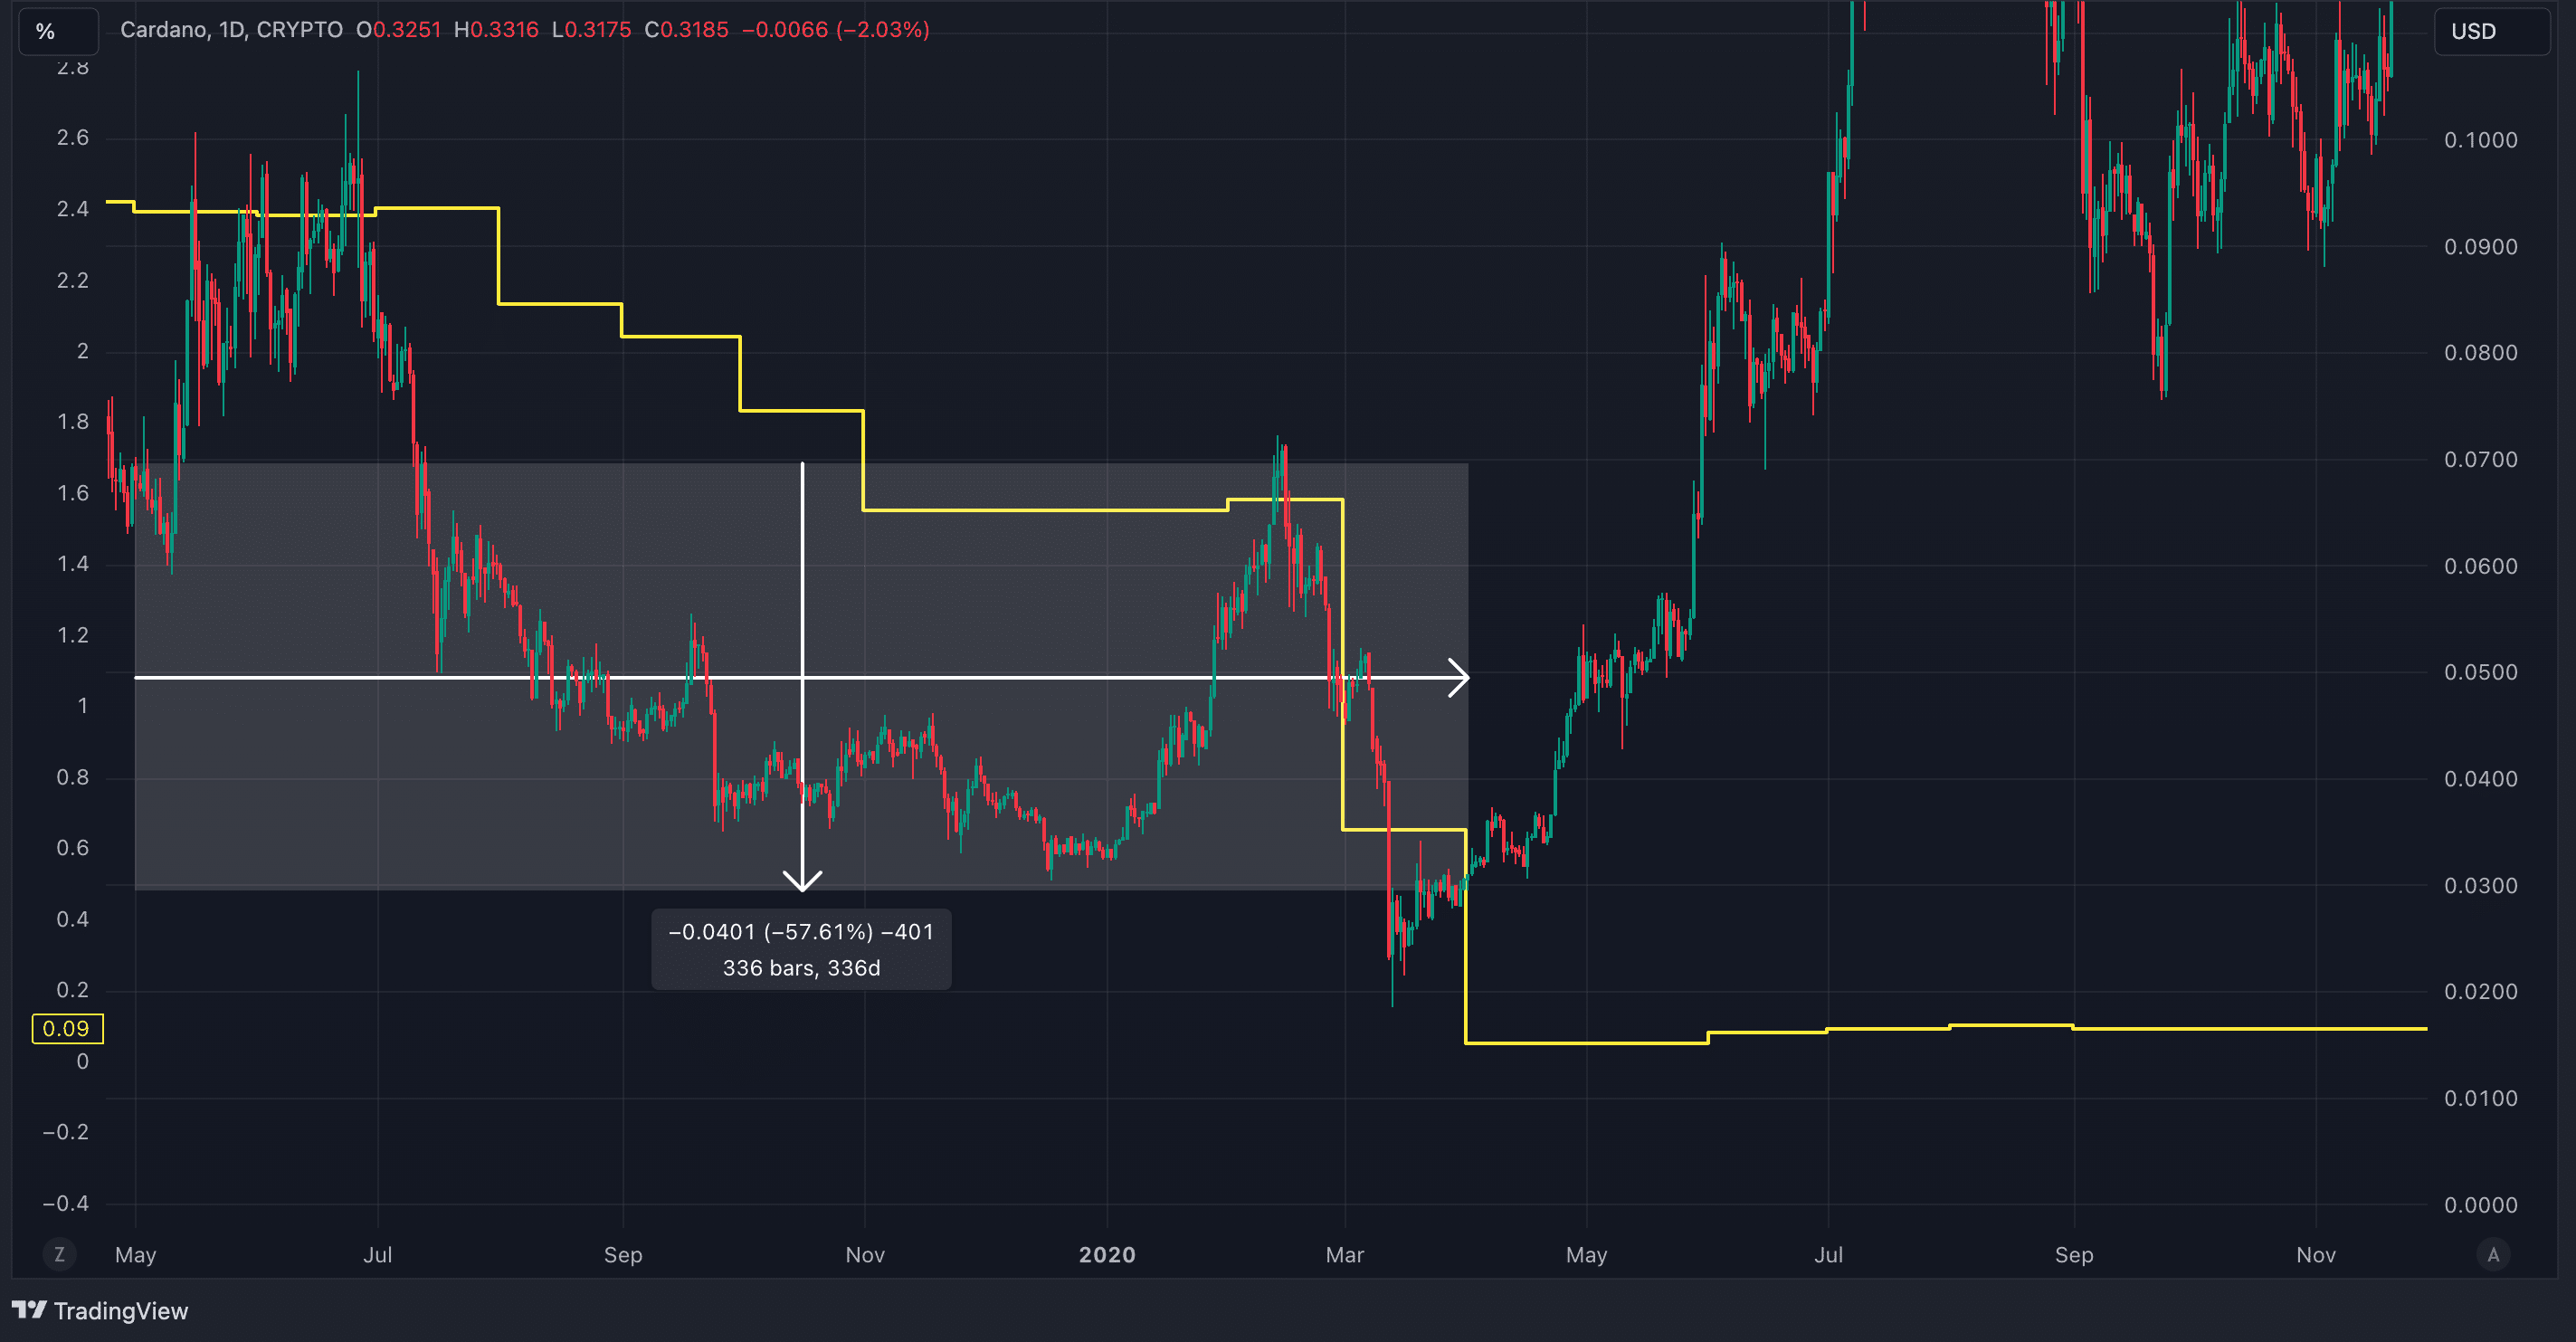
In May 2019, the Federal Reserve initiated its first rate cut, lowering rates from 2.42% to 2.39%. Rates at that time were much lower than today, and the public debt stood at $22 trillion. Today, debt has increased to nearly $35 trillion, and interest rates now stand at 5.33%, more than double the 2019 levels.

When the rates started to fall in 2019, Cardano experienced a sudden drop. After a brief period of recovery, the downtrend continued for months until early 2020. An uptrend emerged later, but the market downturn during the COVID-19 pandemic coincided with further rate cuts. Despite uncertainties around the exact link between rate cuts and crypto declines, Cardano and the broader market saw a clear decrease in value.
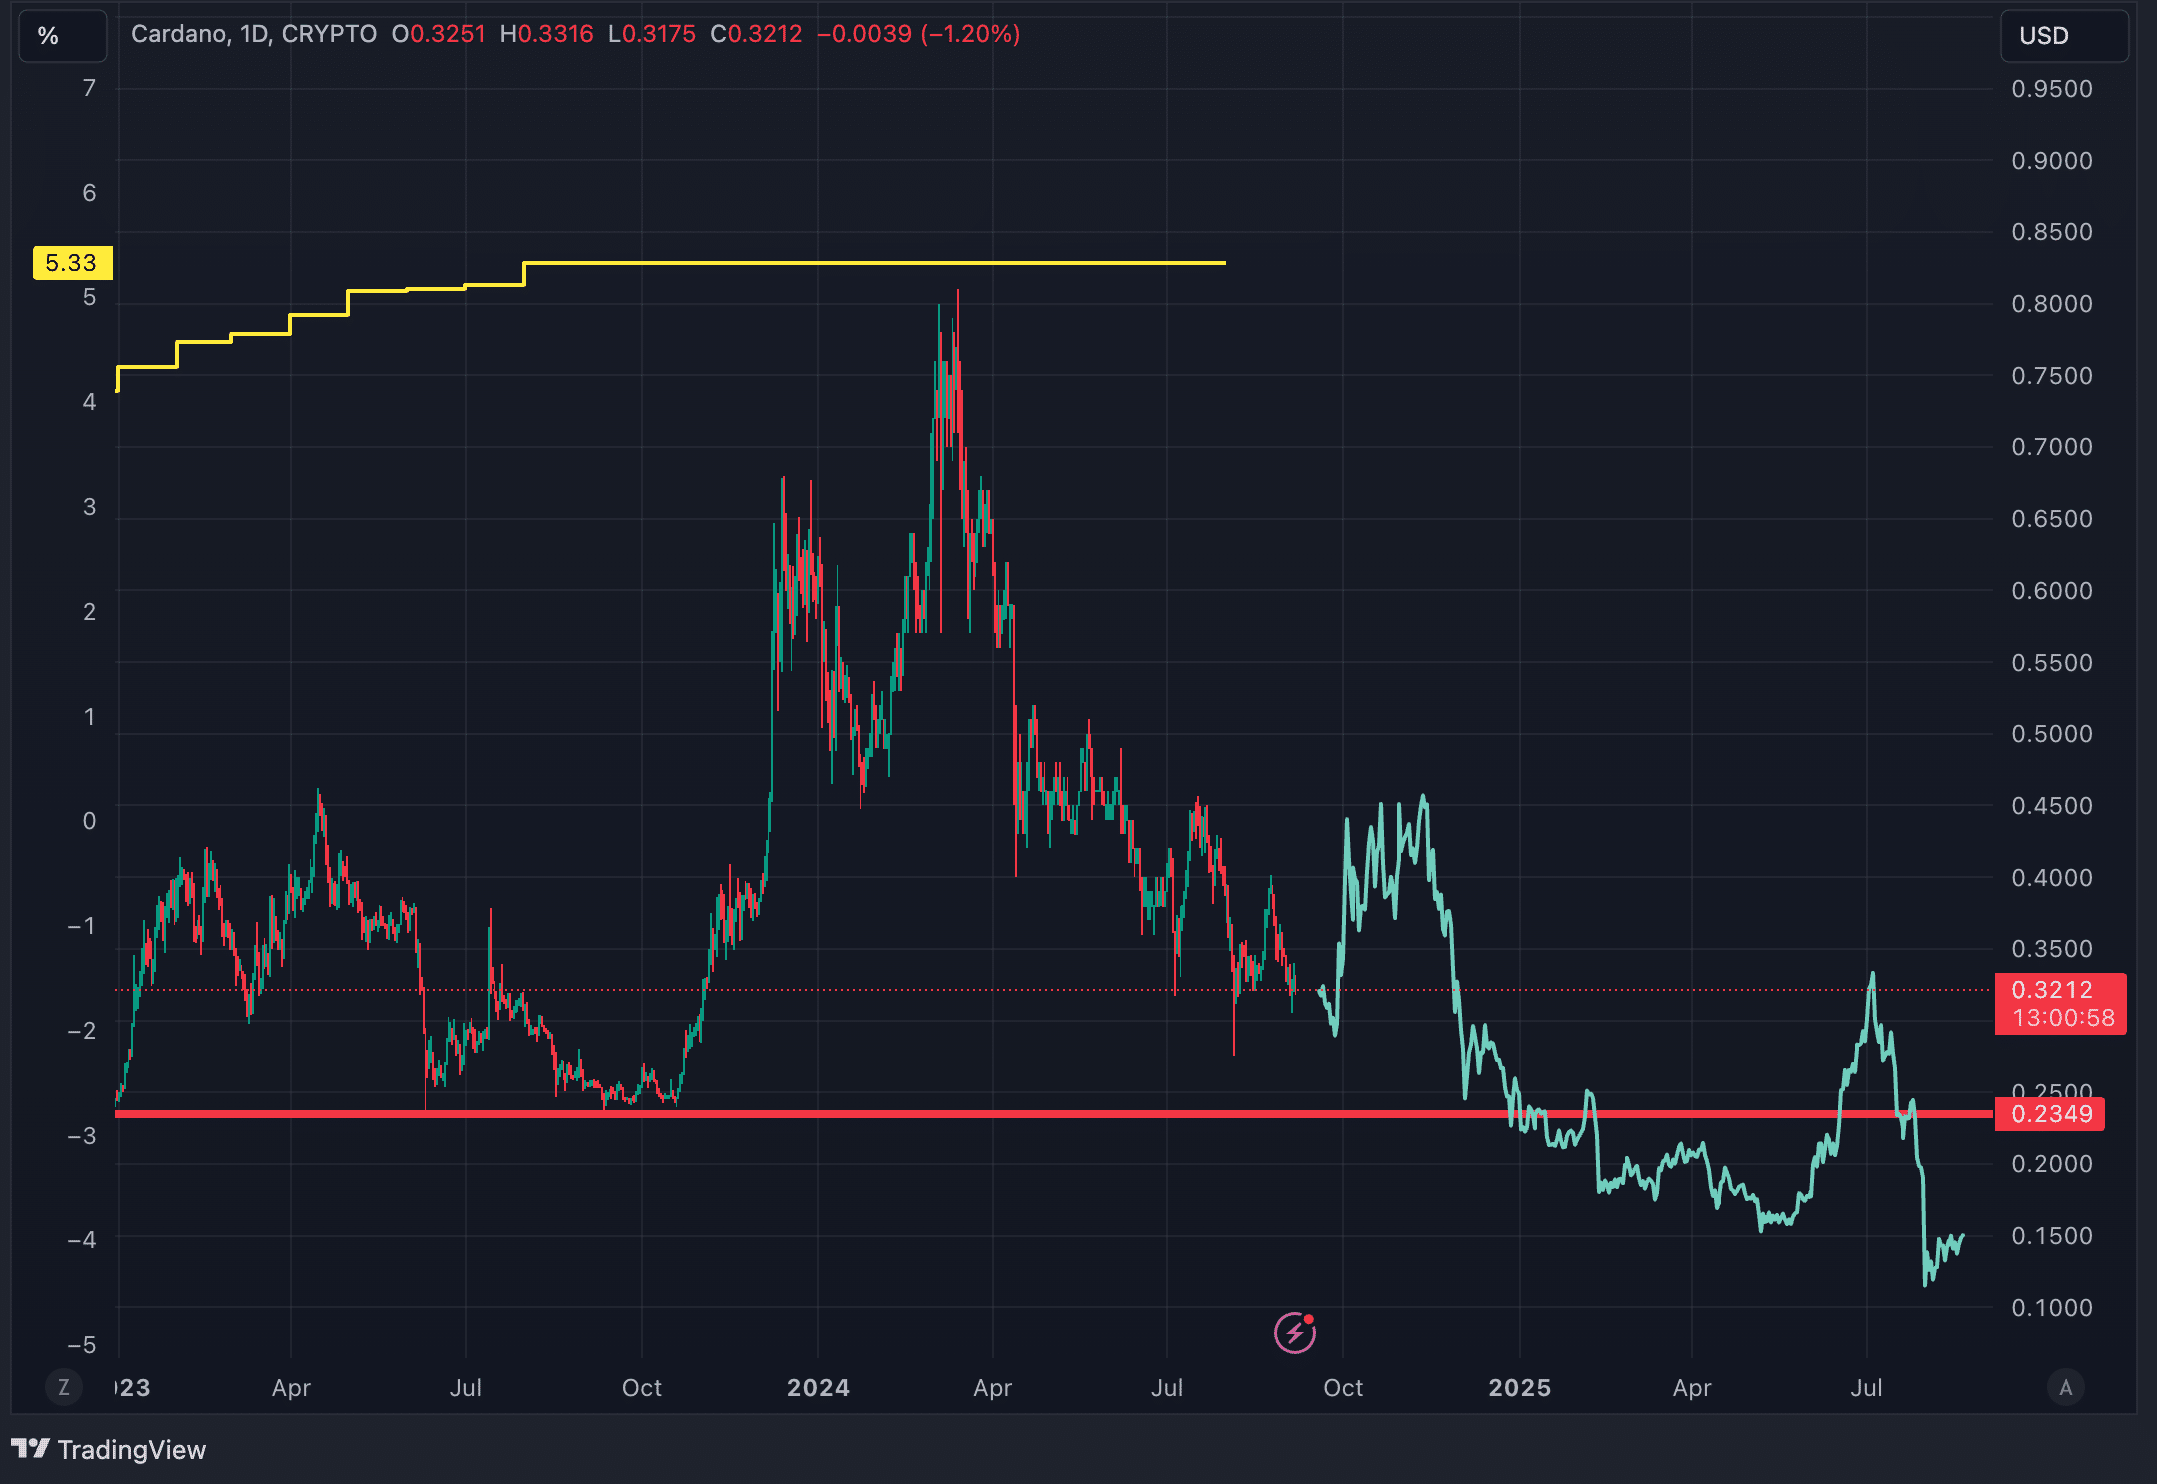
A similar scenario could unfold today. Crypto has shown correlations with traditional finance in the past, including during the 2019 rate cut. The Federal Reserve’s upcoming meeting is likely to result in a rate cut based on CME data. If the market follows the 2019 pattern, Cardano could face a multi-month decline, which could last until the end of the year, before recovering in early 2025. A repeat of the previous trend could push Cardano’s price down to around $0.15.
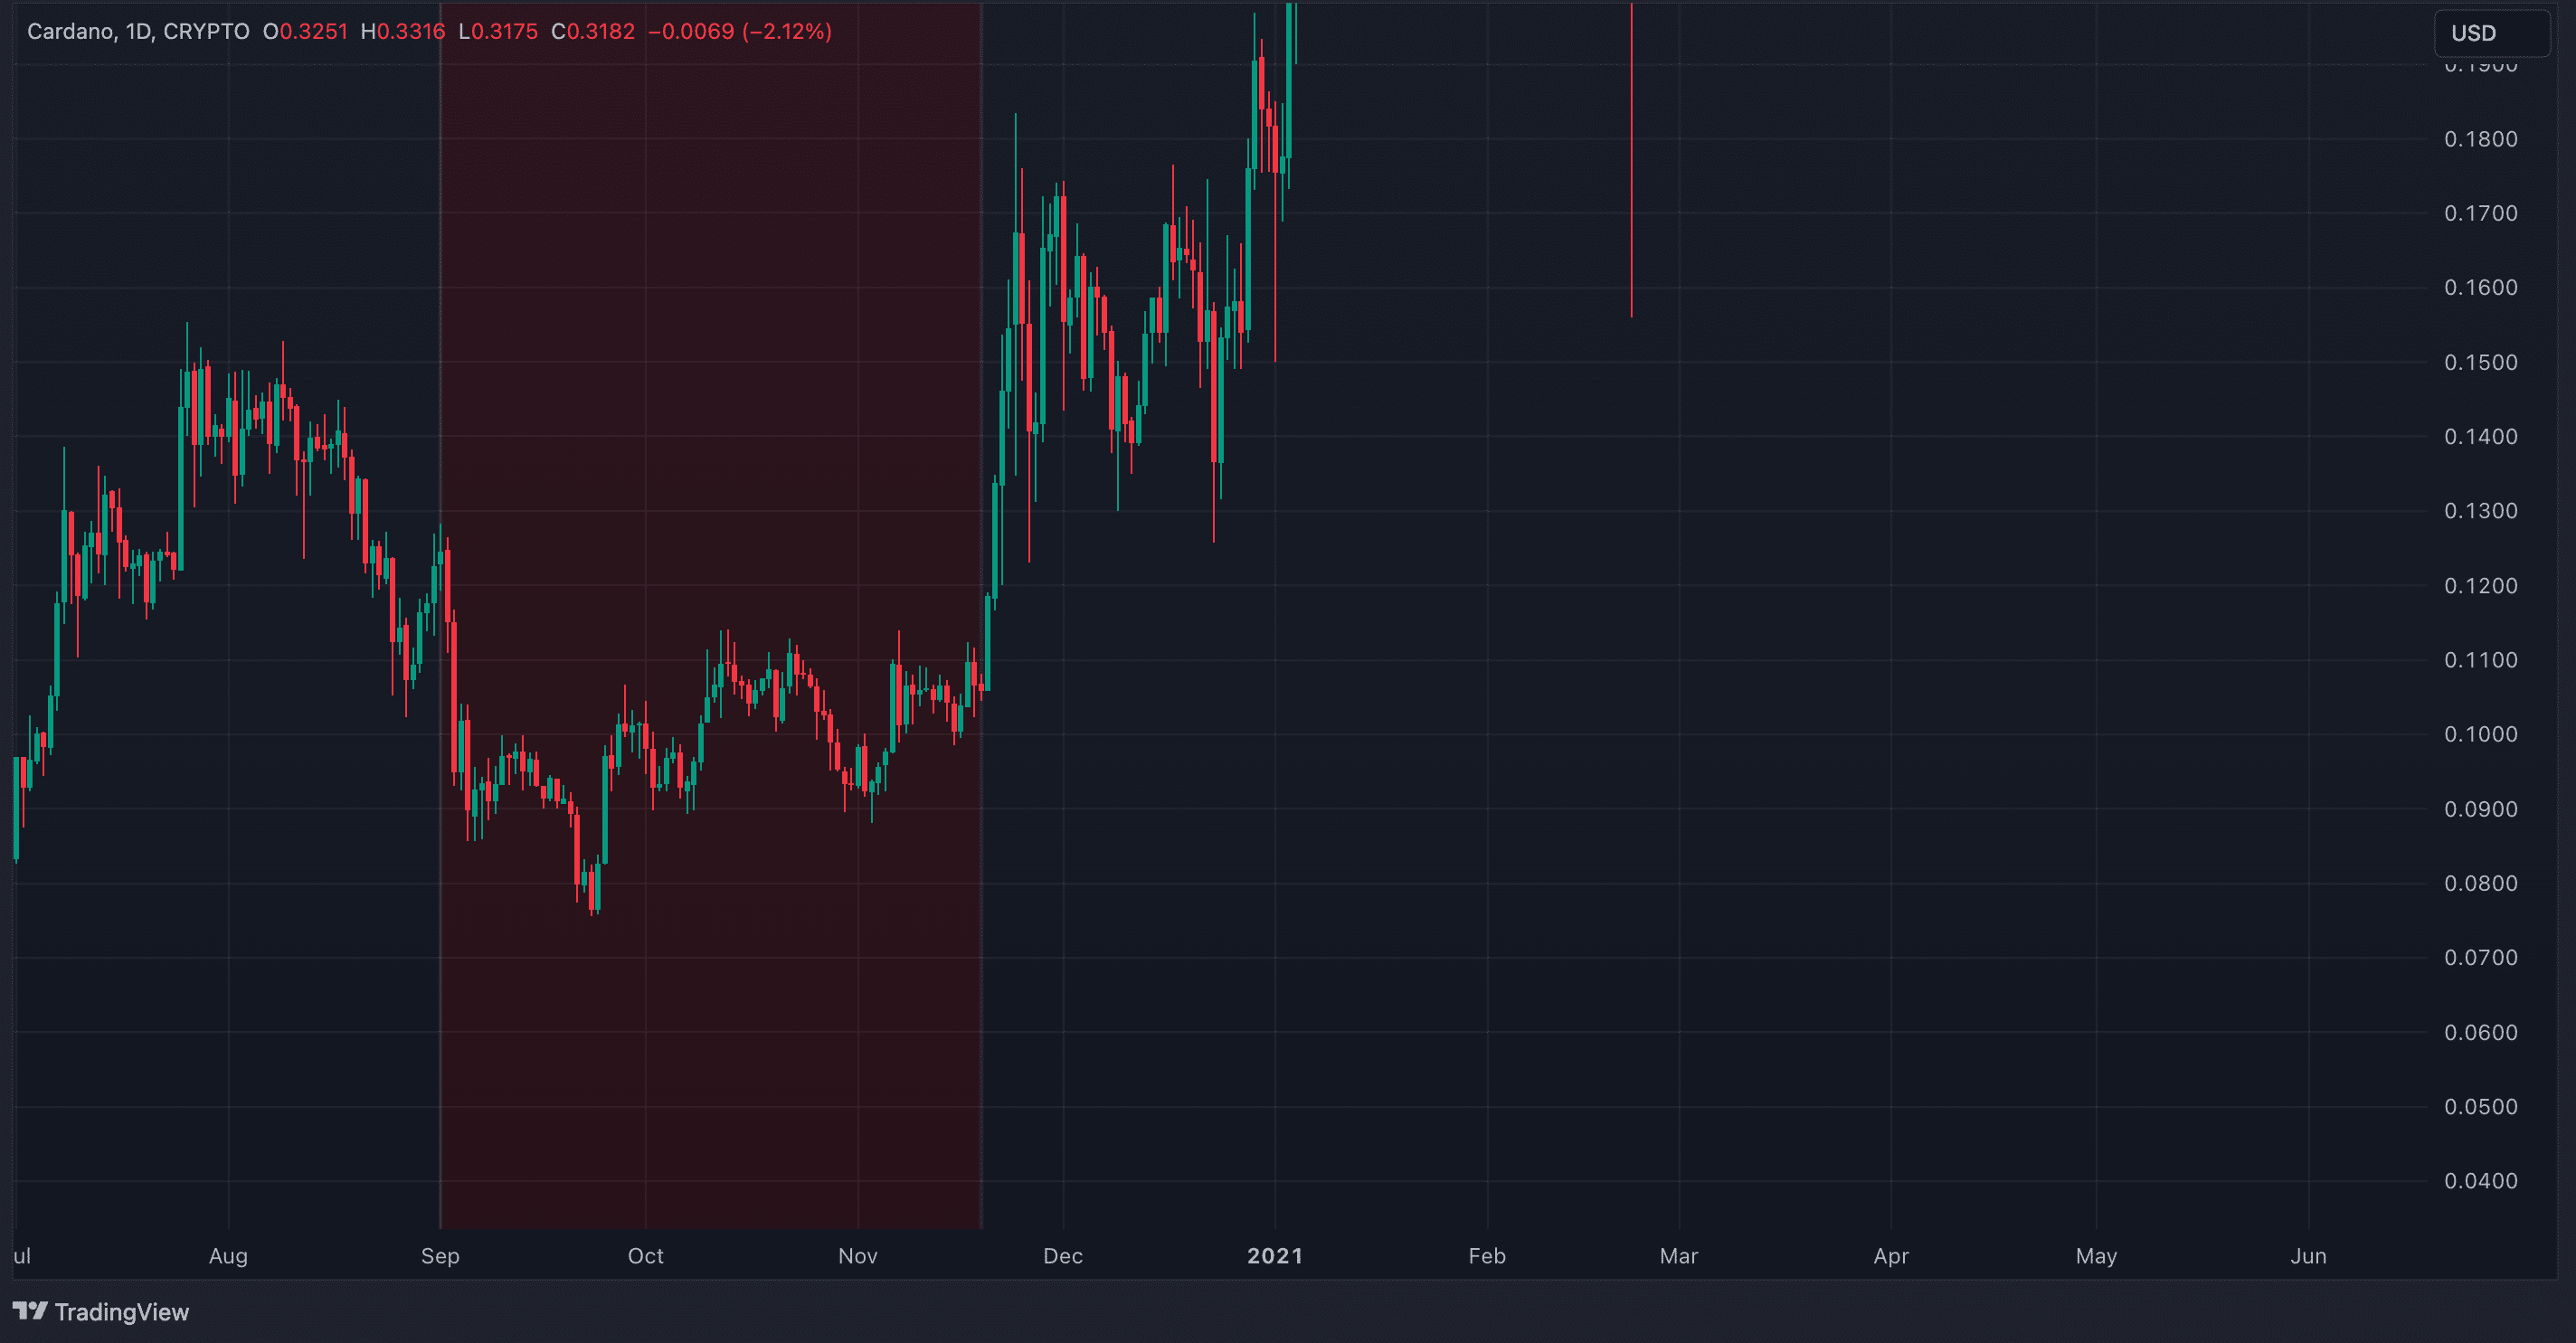
Additionally, September has often proven to be a tough month for both stocks and crypto. In September 2020, during a halving year, Cardano also faced a downtrend. Coupled with the current 10% drop since the start of this month, these factors could drive Cardano toward a deeper fall in the weeks and months ahead below its 2022 support line at $0.2349.
Cardano’s bearish momentum grows with SRSI, MACD, and VRVP
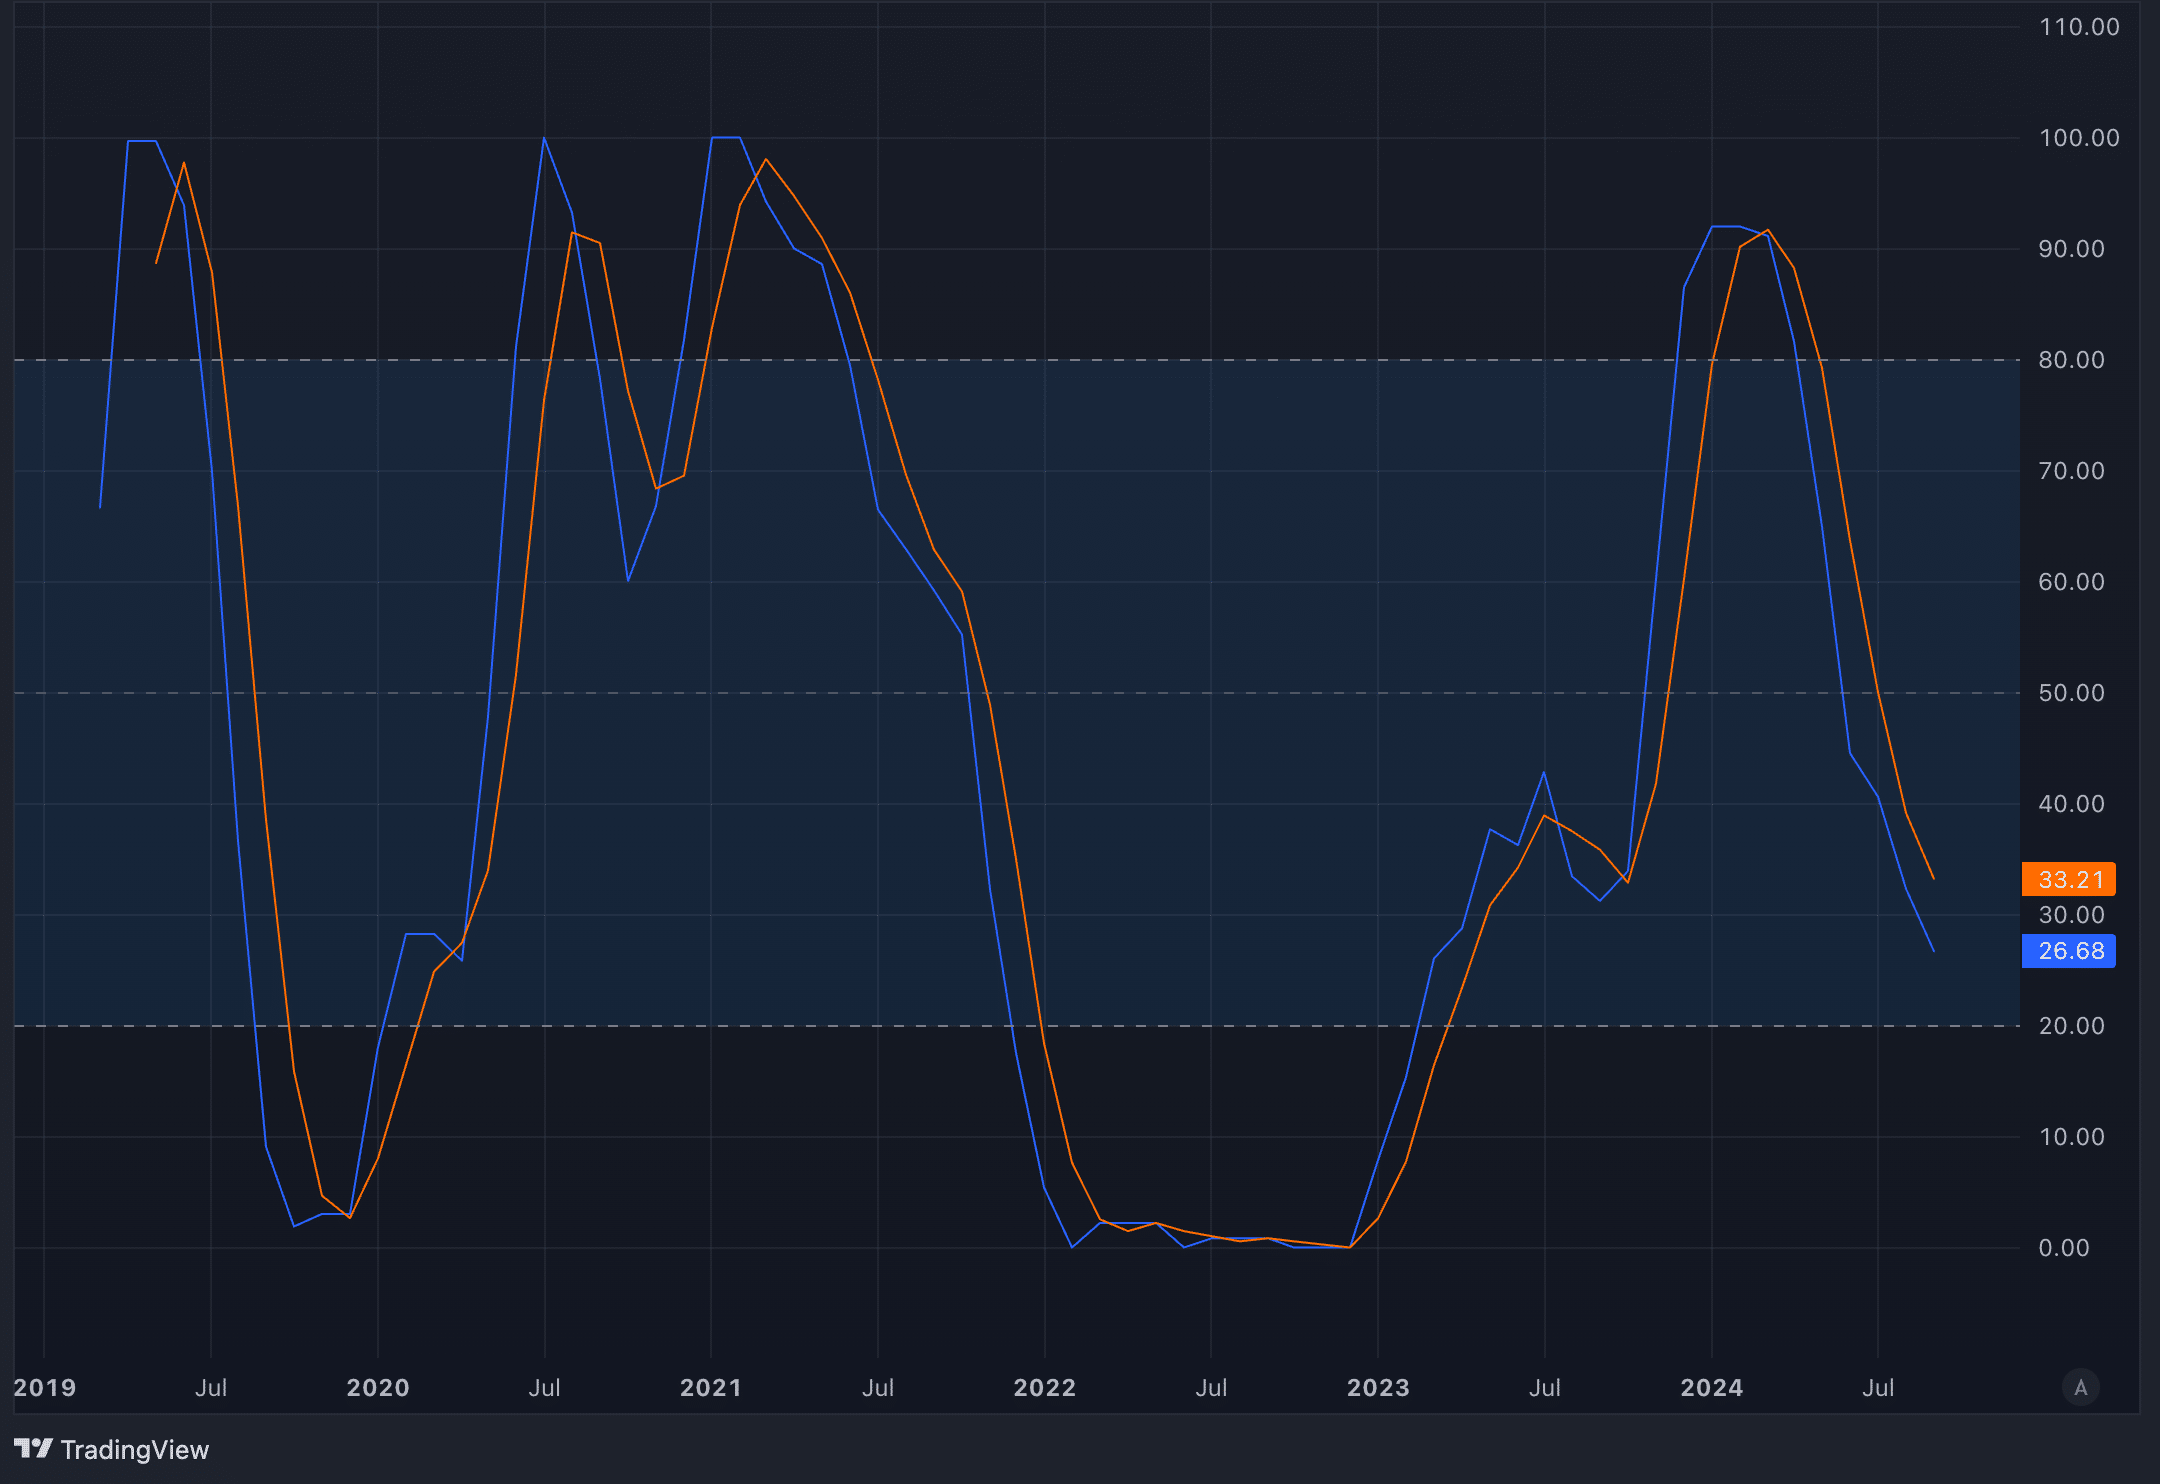
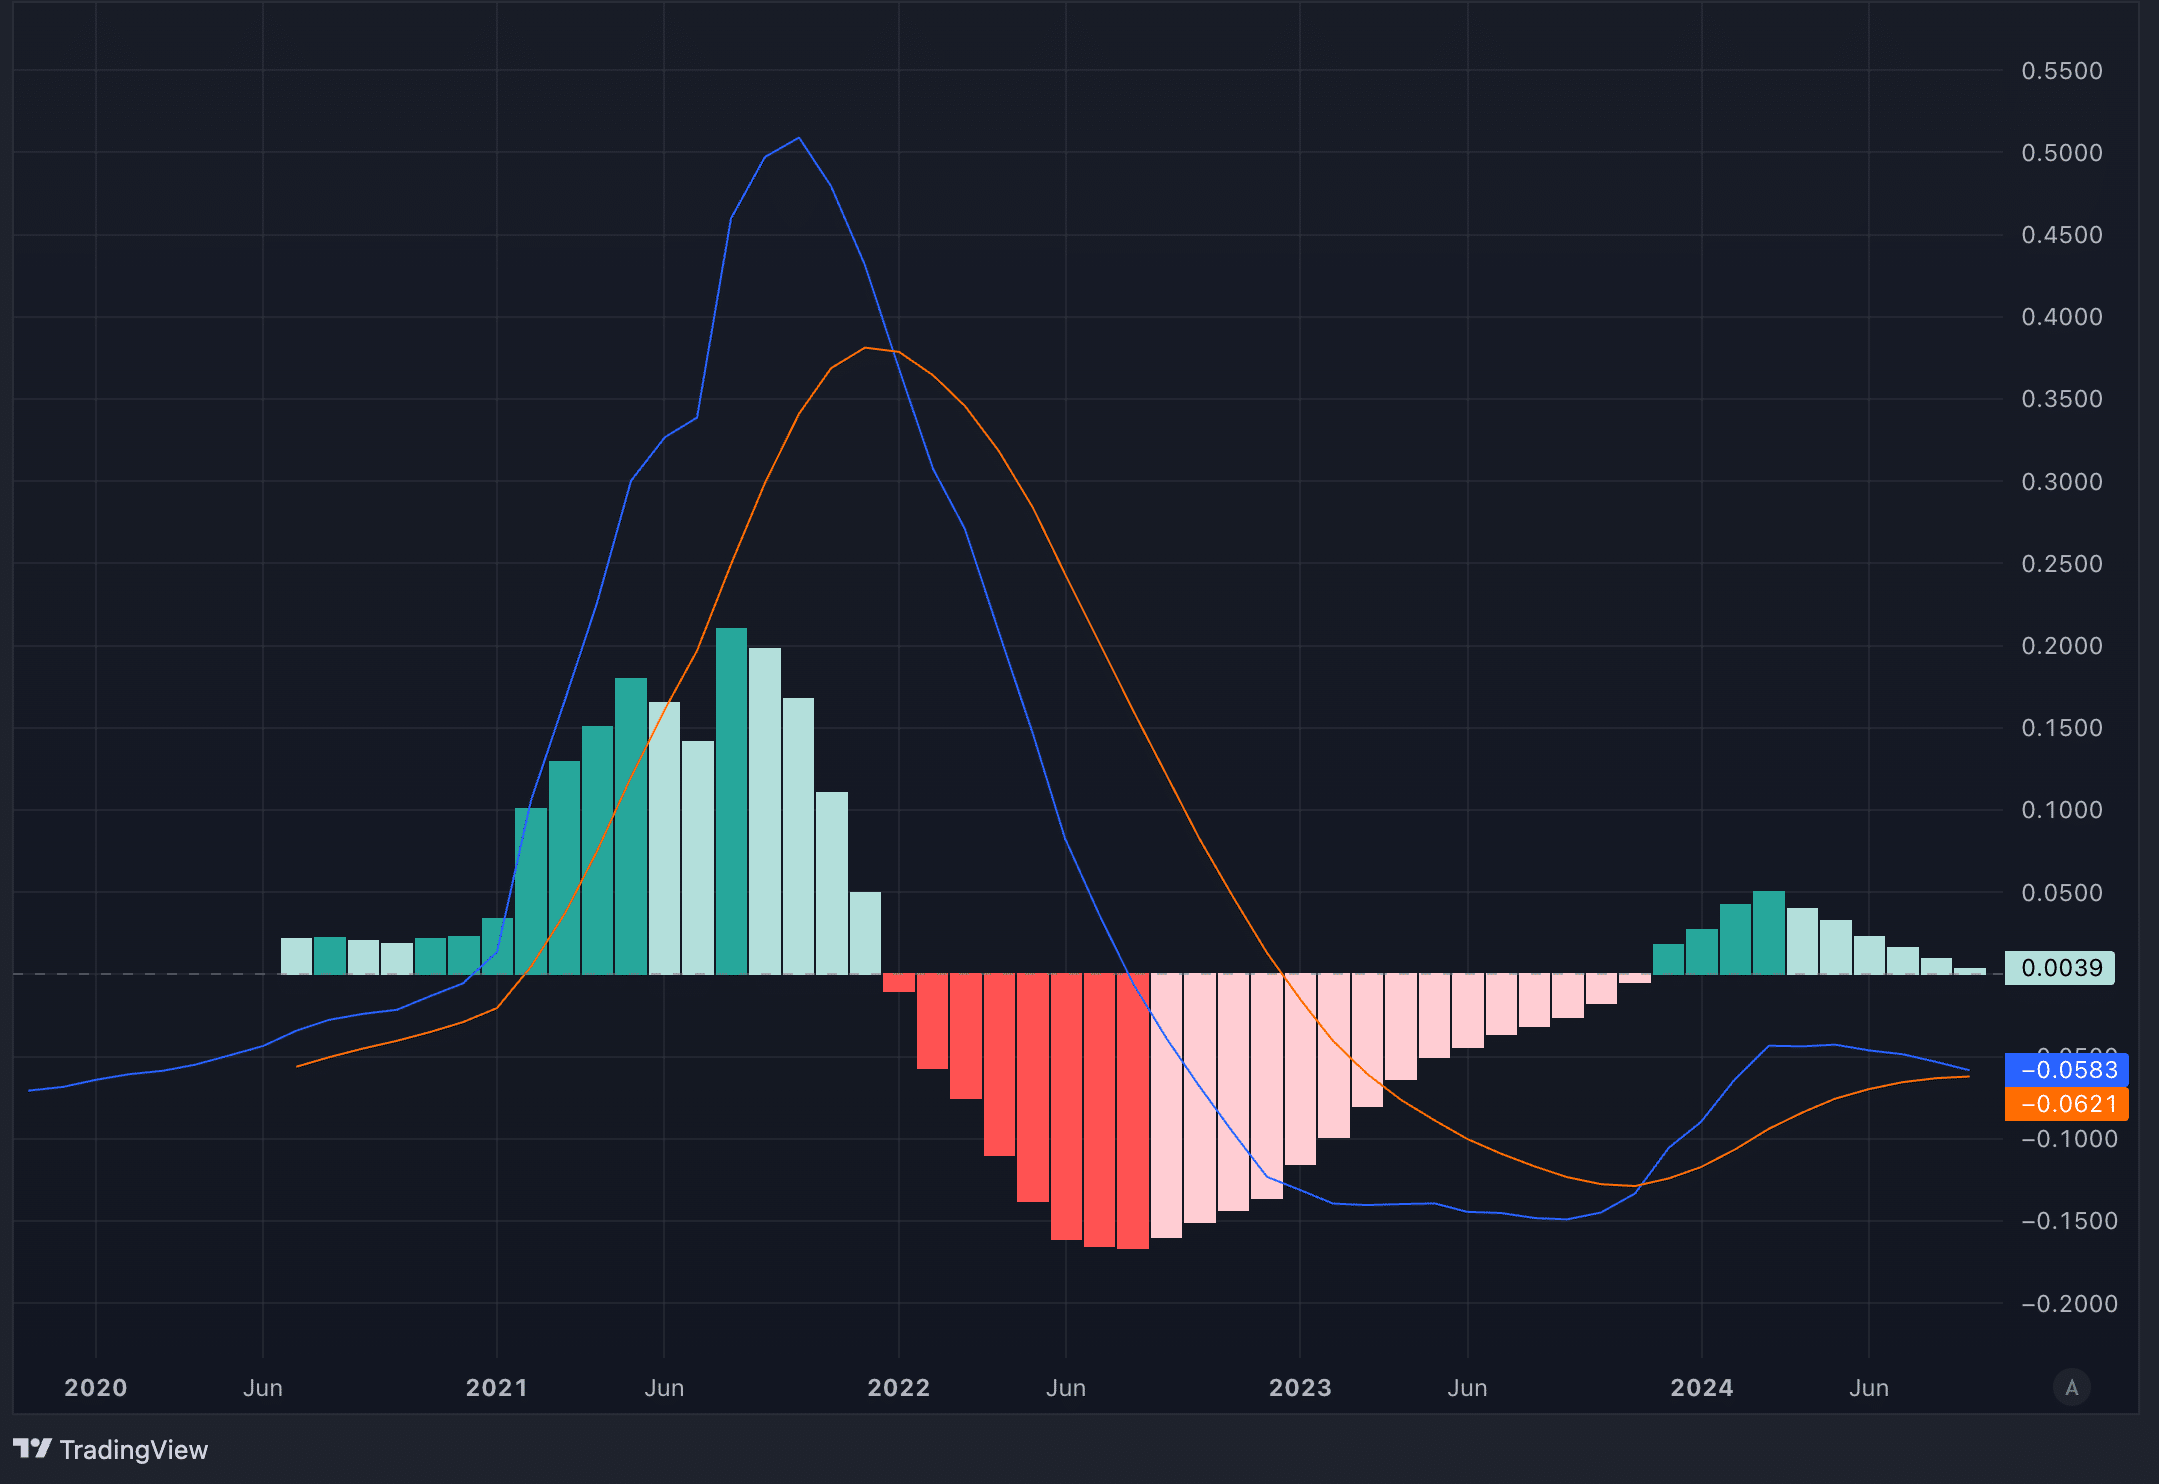
Many traders focus on short-term movements, but stepping back for a longer-term view can give a better sense of the bigger picture. Cardano’s monthly Stochastic RSI (SRSI) and MACD are flashing warning signs that shouldn’t be ignored, and both are painting a rough picture for ADA.
The SRSI tracks momentum by looking at an asset’s price range over time. The scale goes from 0 to 100, with anything below 20 showing oversold conditions. Since March 2024, the SRSI has been sliding, and it’s now closing in on that oversold region.
The MACD, meanwhile, is showing similar bearish vibes. On the monthly chart, the MACD line has already crossed below the signal line, which is a sign of downward pressure. The histogram, which shows the gap between the two lines, is about to flip red, also pointing to a growing bearish momentum.
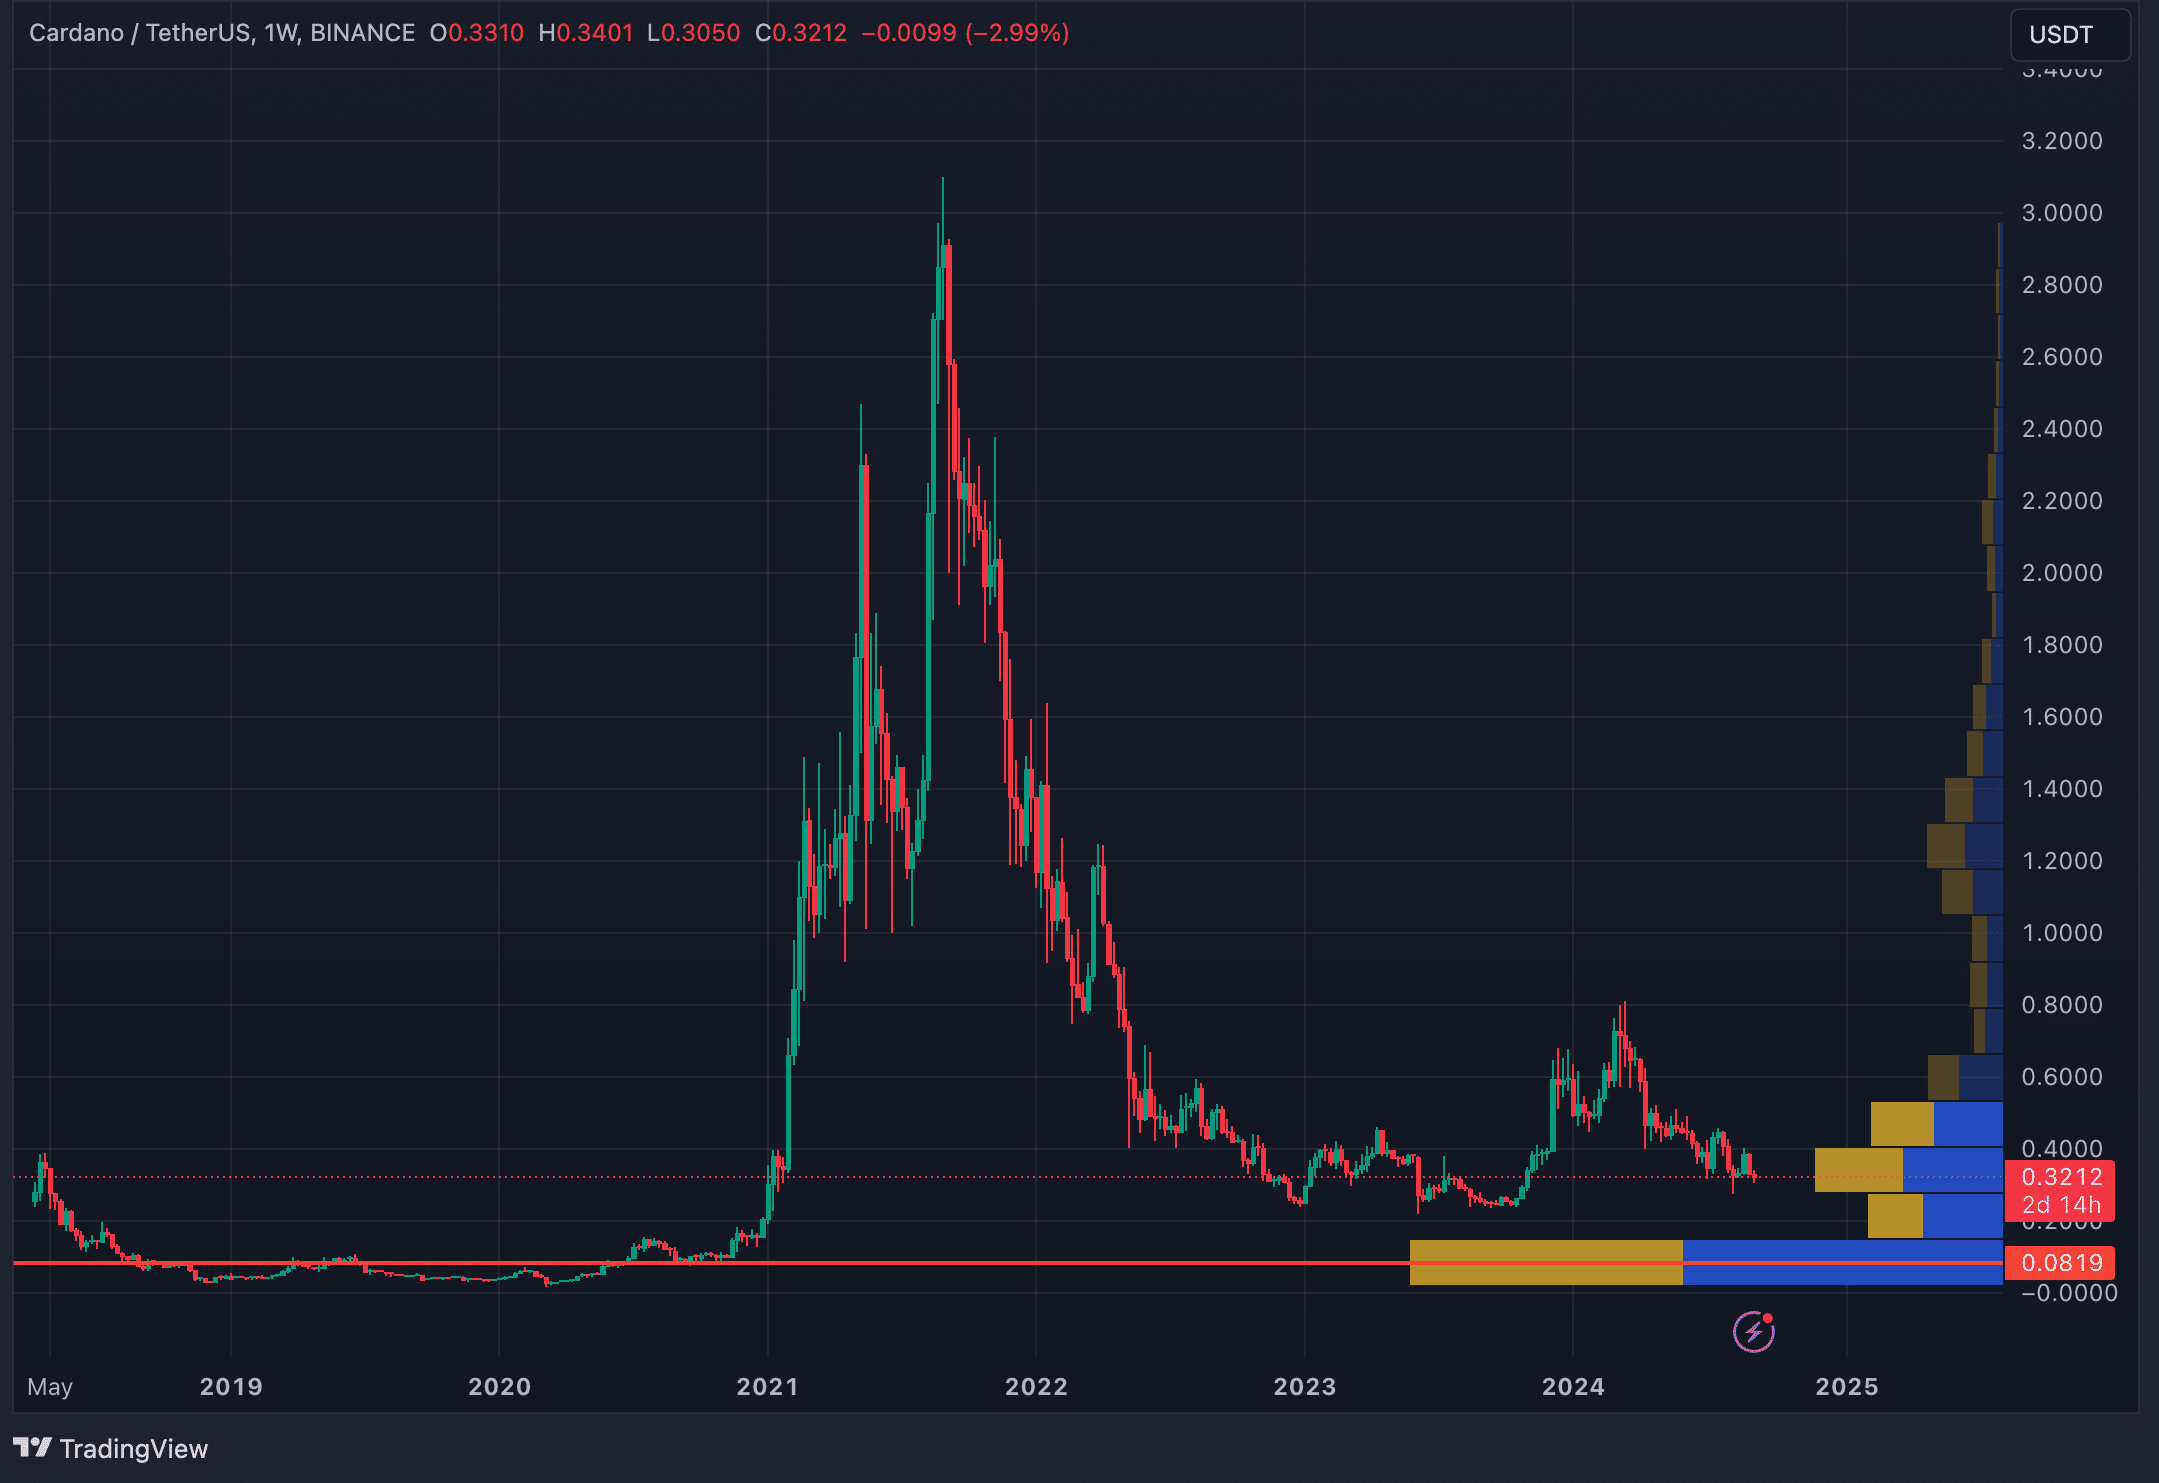
Alongside the bearish signals from the Stochastic RSI and MACD, the Visible Range Volume Profile (VRVP) adds even more negative pressure to the outlook. The VRVP shows where most trading volumes occurred at various price levels. In Cardano’s case, the volume bars within the current price range are quite thin, which indicates weak support. The biggest volume bar begins at the $0.15 level, suggesting a strong support zone there. Below the current price, there’s a gap in the volume profile, which means if Cardano continues to fall, there’s little trading activity to slow down the drop until it reaches that $0.15 zone.
Is Cardano’s 2022 support line strong enough to hold?
Despite the bearish indicators, a couple of factors could prevent Cardano from dropping sharply. At the moment, the price sits within a macro Fibonacci golden pocket, drawn from the all-time low to the recent high in March 2024. This zone, between $0.2951 and $0.3204, has acted as support for now. However, when looking at other Fibonacci retracements from different points, ADA has already fallen below the 78.6% retracement on every one of them. This could raise doubts about the strength of the current golden pocket, as there’s a possibility it may not hold up in the long term.
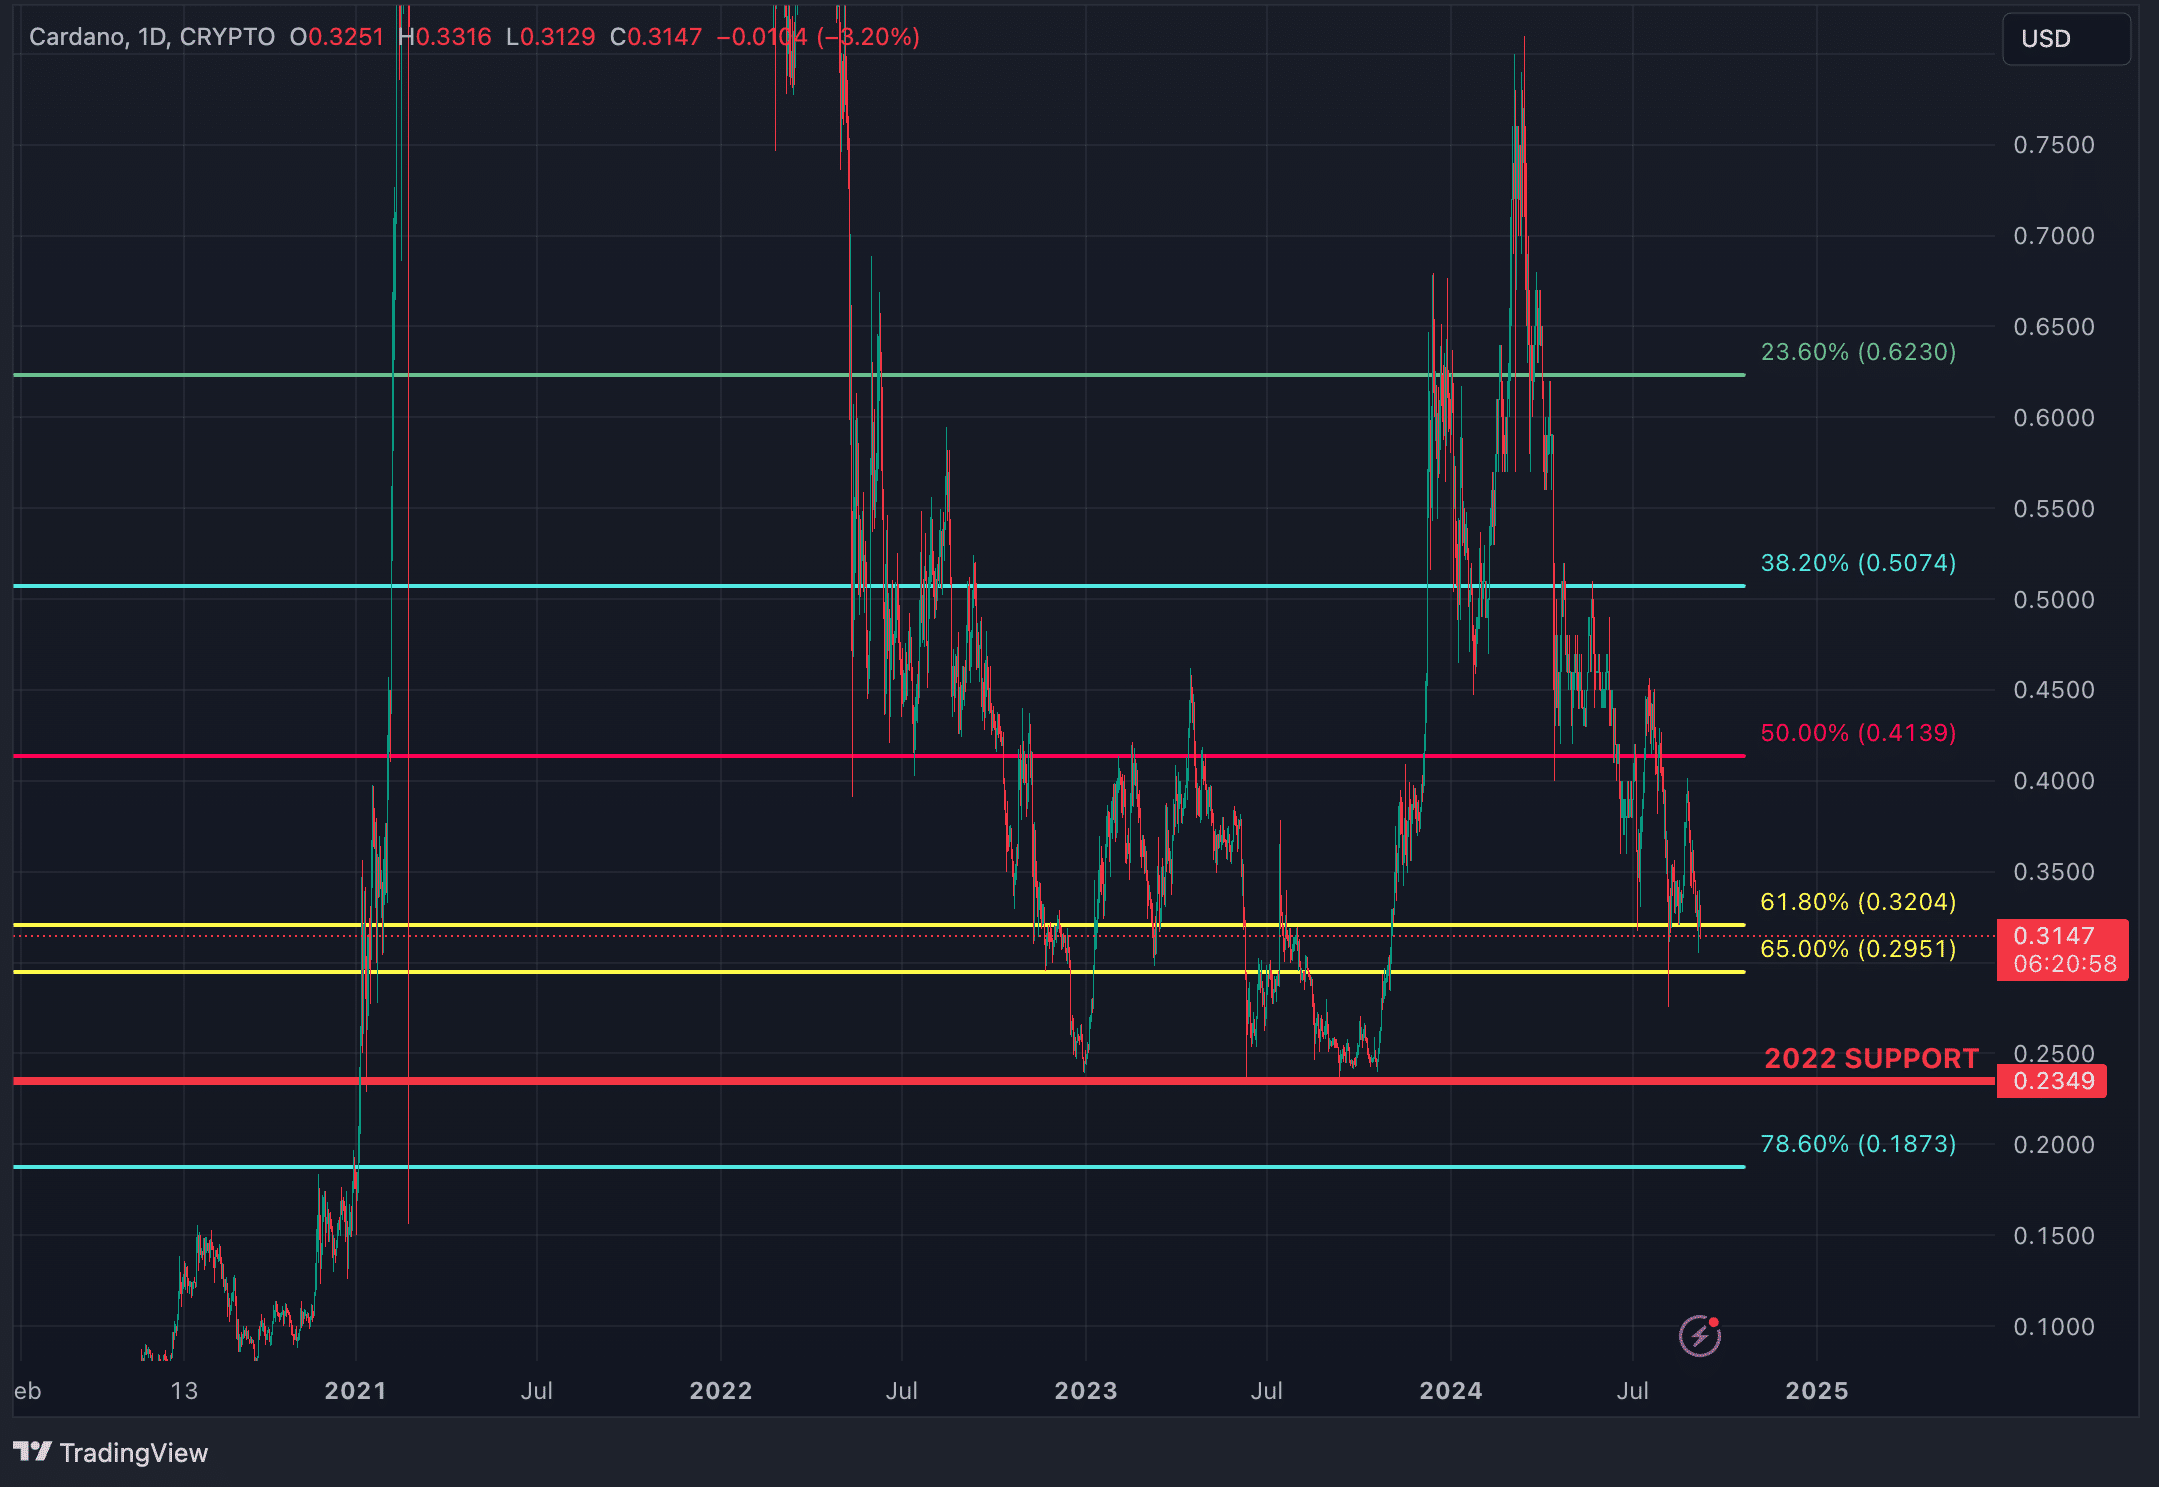
A stronger support level, however, lies at $0.2349, a line that was respected during the 2022 bear market. But, with ADA currently around $0.315, a drop to that support would still represent a 25% decline, which would be far from ideal.
Strategic considerations
In our view, there could be a dead cat bounce before the September 18 Fed meeting. However, after that, ADA is likely to face a 2-3 month downtrend until the Fed slows the pace of its rate cuts. A more cautious strategy would be to wait for ADA to drop below the $0.2951 golden pocket before shorting. This offers a safer entry point compared to shorting immediately right now, as Cardano could see a short-term uptrend while holding above the golden pocket. If the price falls below this level, shorting down to $0.2349 becomes a more calculated move.
Disclosure: This article does not represent investment advice. The content and materials featured on this page are for educational purposes only.


