Could VIRTUAL rally to $3.3 as a potential golden cross looms?


Virtuals Protocol appears poised for further gains backed by strong technicals and growing institutional interest.
According to data from crypto.news, Virtuals Protocol (VIRTUAL) shot up 19% to hit an intraday high of $2.53 on Wednesday, May 28, during afternoon trading in Asia. This pushed its market cap close to $1.6 billion.
With this move, the token is now up over 500% from its year-to-date low, showing strong investor interest.
One key factor driving this rally is Grayscale’s recent announcement that it has added VIRTUAL to its newly launched Artificial Intelligence Crypto Sector Index. The index includes 20 AI-focused tokens and aims to track the sector’s top-performing assets. VIRTUAL’s inclusion signals growing institutional recognition of its role in the AI and crypto space.
Another catalyst is the upcoming NVIDIA earnings report, which is widely anticipated across markets. Analysts expect NVIDIA’s Q1 revenue to rise 65% to around $43.17 billion, with earnings per share climbing from $0.61 to $0.73.
The company’s Q2 revenue guidance could hit $45 billion. Since NVIDIA is a major player in AI hardware, a strong report could further boost sentiment around AI-related tokens like VIRTUAL.
Adding to the bullish narrative, Virtuals Protocol also just rolled out a new feature called TP Cooldown History. This update, part of the Genesis system, gives users (referred to as “Virgens”) more clarity on when and why they’re under cooldown, helping them understand how certain actions, like selling Genesis agents, impact their points and cooldown periods.
It’s a move toward more transparency and a better user experience, which has been well-received by community members.
VIRTUAL price analysis
From a technical standpoint, VIRTUAL is flashing bullish signals. The token formed a bullish engulfing candle on Tuesday’s daily chart, confirming a U-shaped recovery that’s been forming since its April correction.
Crucially, VIRTUAL broke above the $2.22 resistance, which also served as the neckline of a cup-like pattern. It then went on to break above the upper boundary of an ascending triangle, a pattern that typically signals a potential upward breakout.
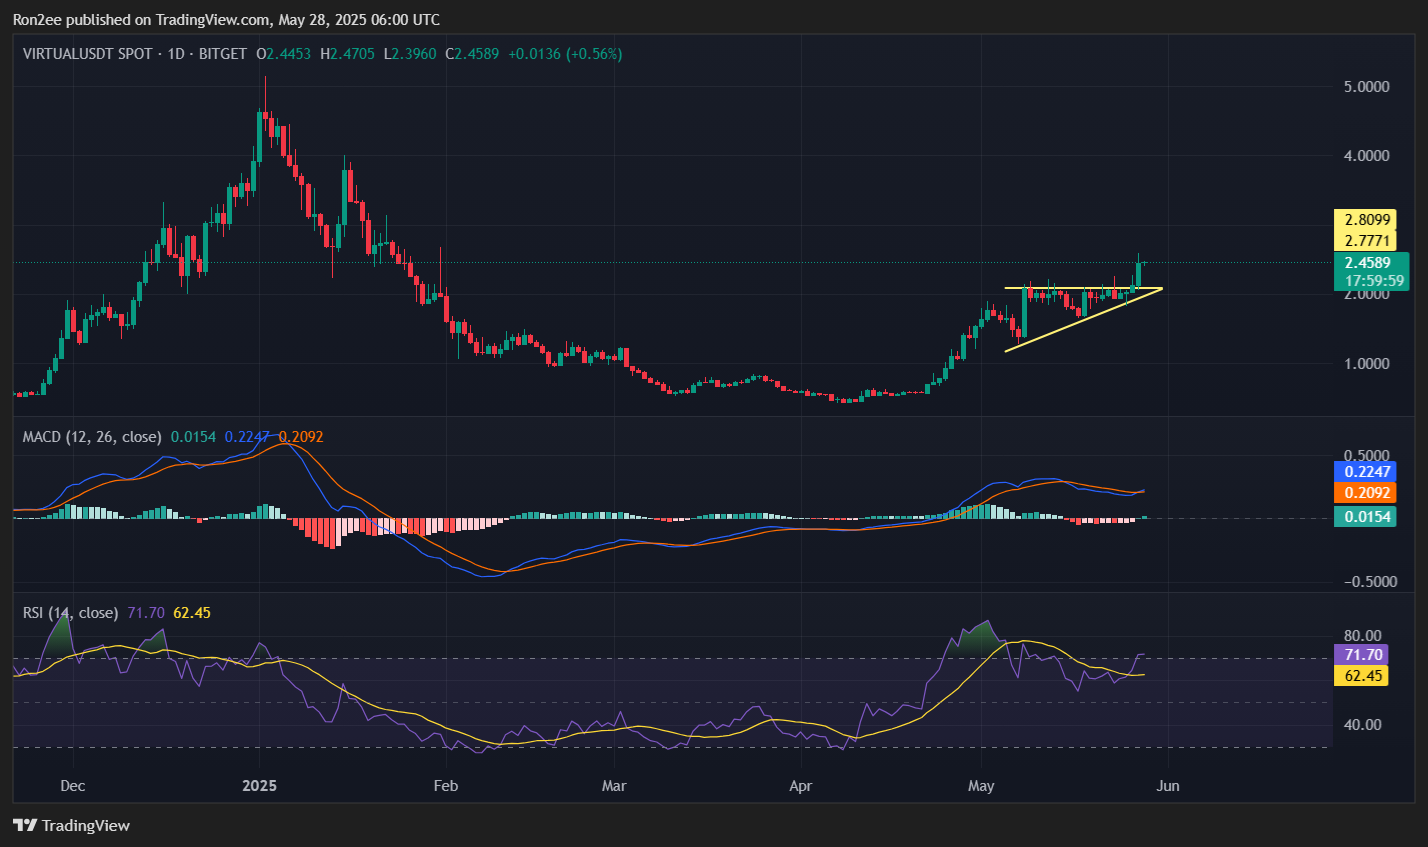
Momentum indicators support the bullish case with the MACD line having crossed above the signal line, indicating continued buying strength.
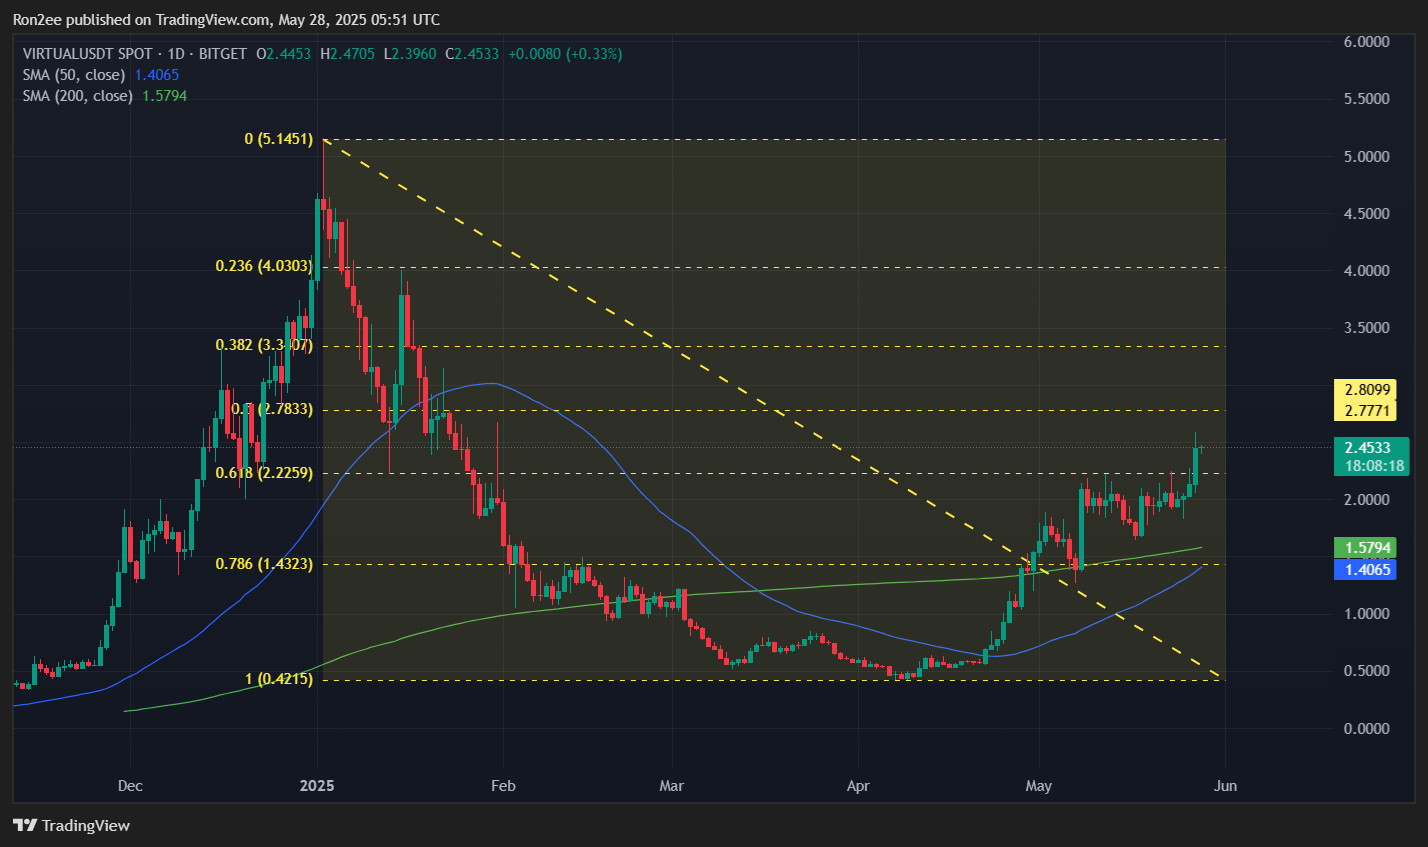
The price has also moved above both the 50-day and 200-day moving averages, which are now nearing a golden cross, a classic bullish signal, while the Relative Strength Index is trending upward, showing strong buying pressure.
If the bulls hold control, VIRTUAL could next target $2.78, a level aligned with the 50% Fibonacci retracement. A breakout above that would open the door to $3.38, which aligns with the 0.382 Fibonacci level, roughly 38% higher than current prices.
However, if sellers push back from $2.78, the price could retest $2.22, which now acts as a key support and also lines up with the 78.6% Fibonacci retracement level.
Disclosure: This article does not represent investment advice. The content and materials featured on this page are for educational purposes only.