Dogecoin price patterns point to a surge as whale accumulation resumes


Dogecoin price remains under pressure this week as risk-off sentiment prevails in the crypto and stock markets.
Dogecoin (DOGE) dropped to $0.2200 on Tuesday, down 15% from its highest point this month. This decline, however, could be the calm before the storm ahead of a potential rebound.
Whale accumulation is continuing
One of the key indicators in crypto fundamental analysis is whale activity. Whales, or large investors,are often considered more sophisticated and experienced players in the market.
Typically, whales accumulate when they expect an asset’s price to rebound, and sell or short when they anticipate further declines.
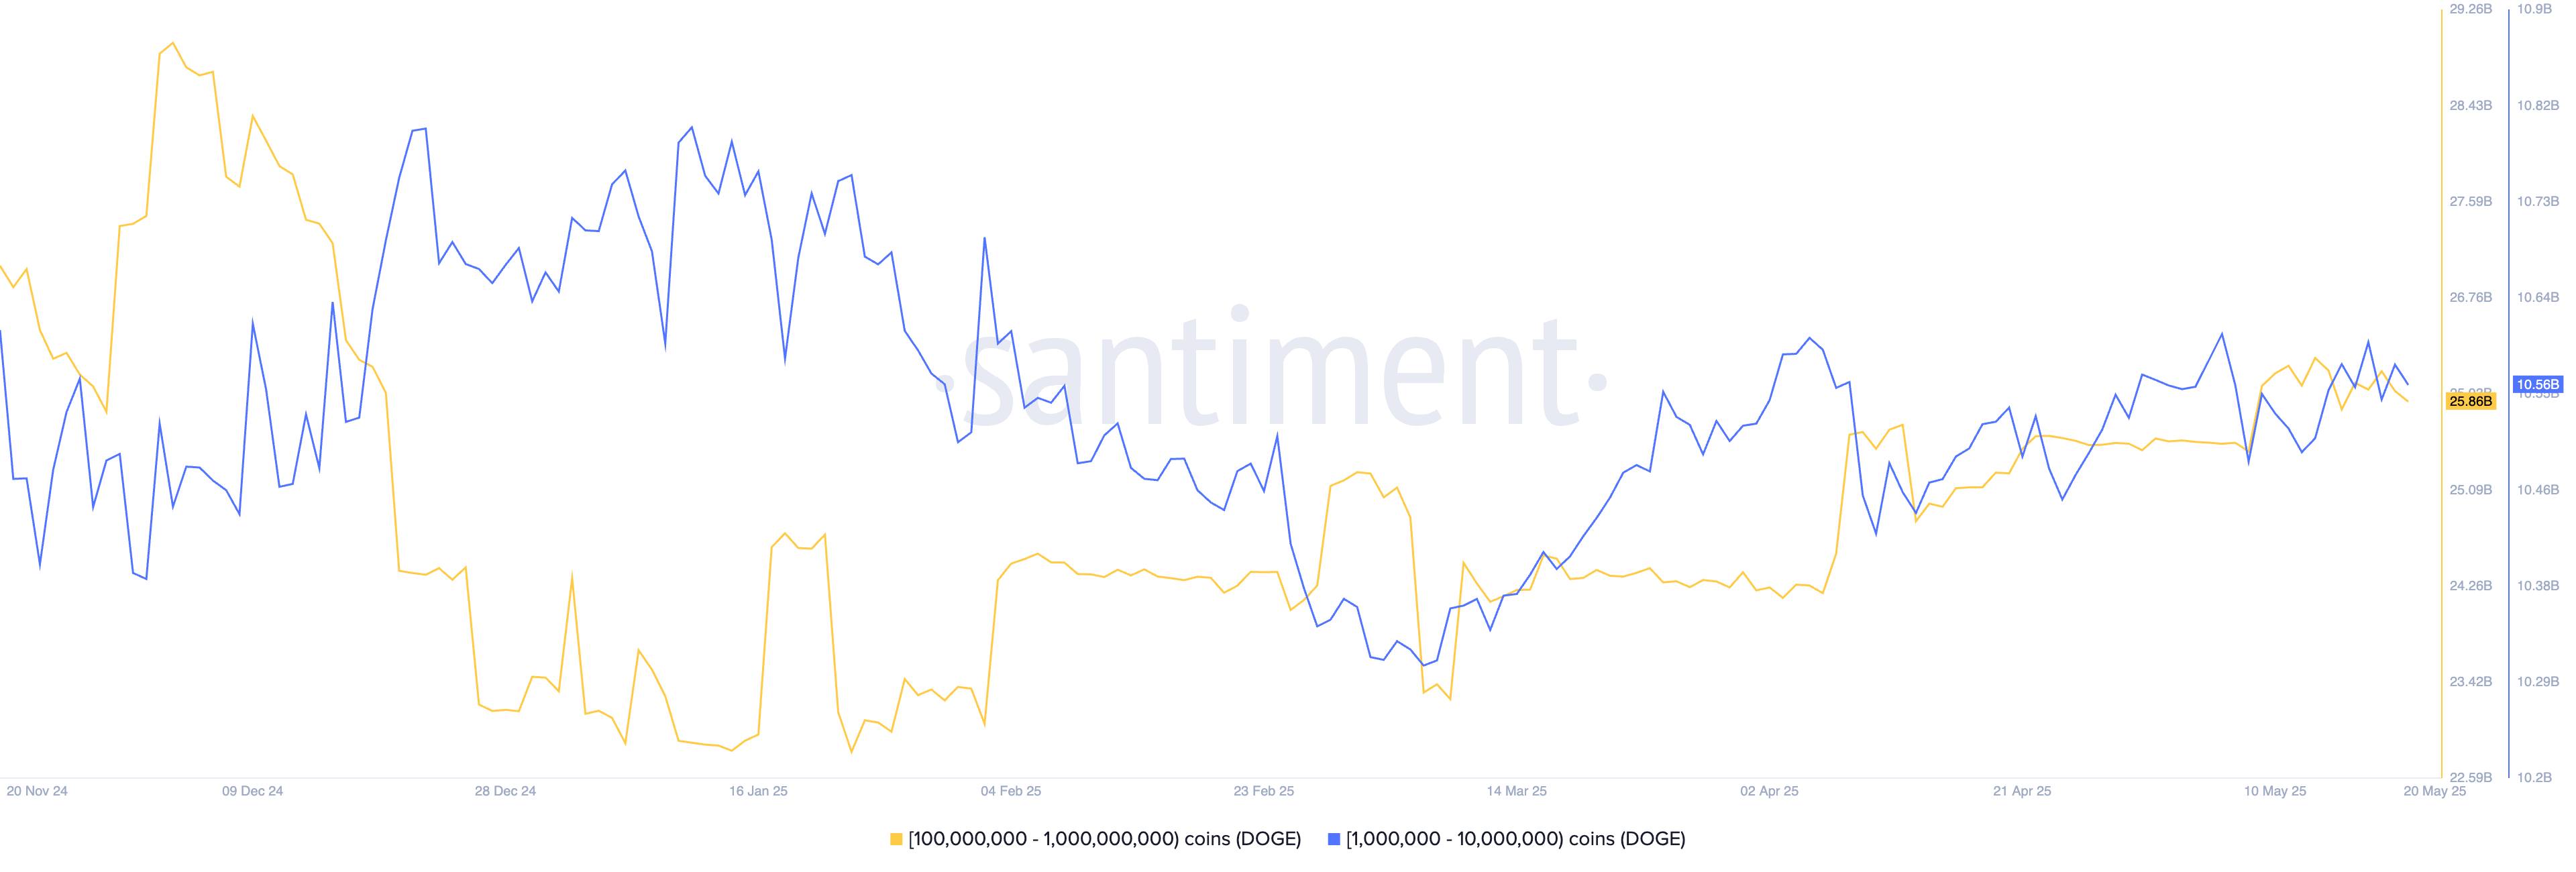
Recent data shows Dogecoin whales are beginning to accumulate. According to Santiment, addresses holding between 1 million and 10 million DOGE now hold 10.56 billion coins, up from 10.48 billion on May 10.
Likewise, wallets holding between 100 million and 1 billion tokens now hold 25.86 billion coins, an increase from 25.53 billion earlier this month.
Dogecoin price formed a bullish flag pattern
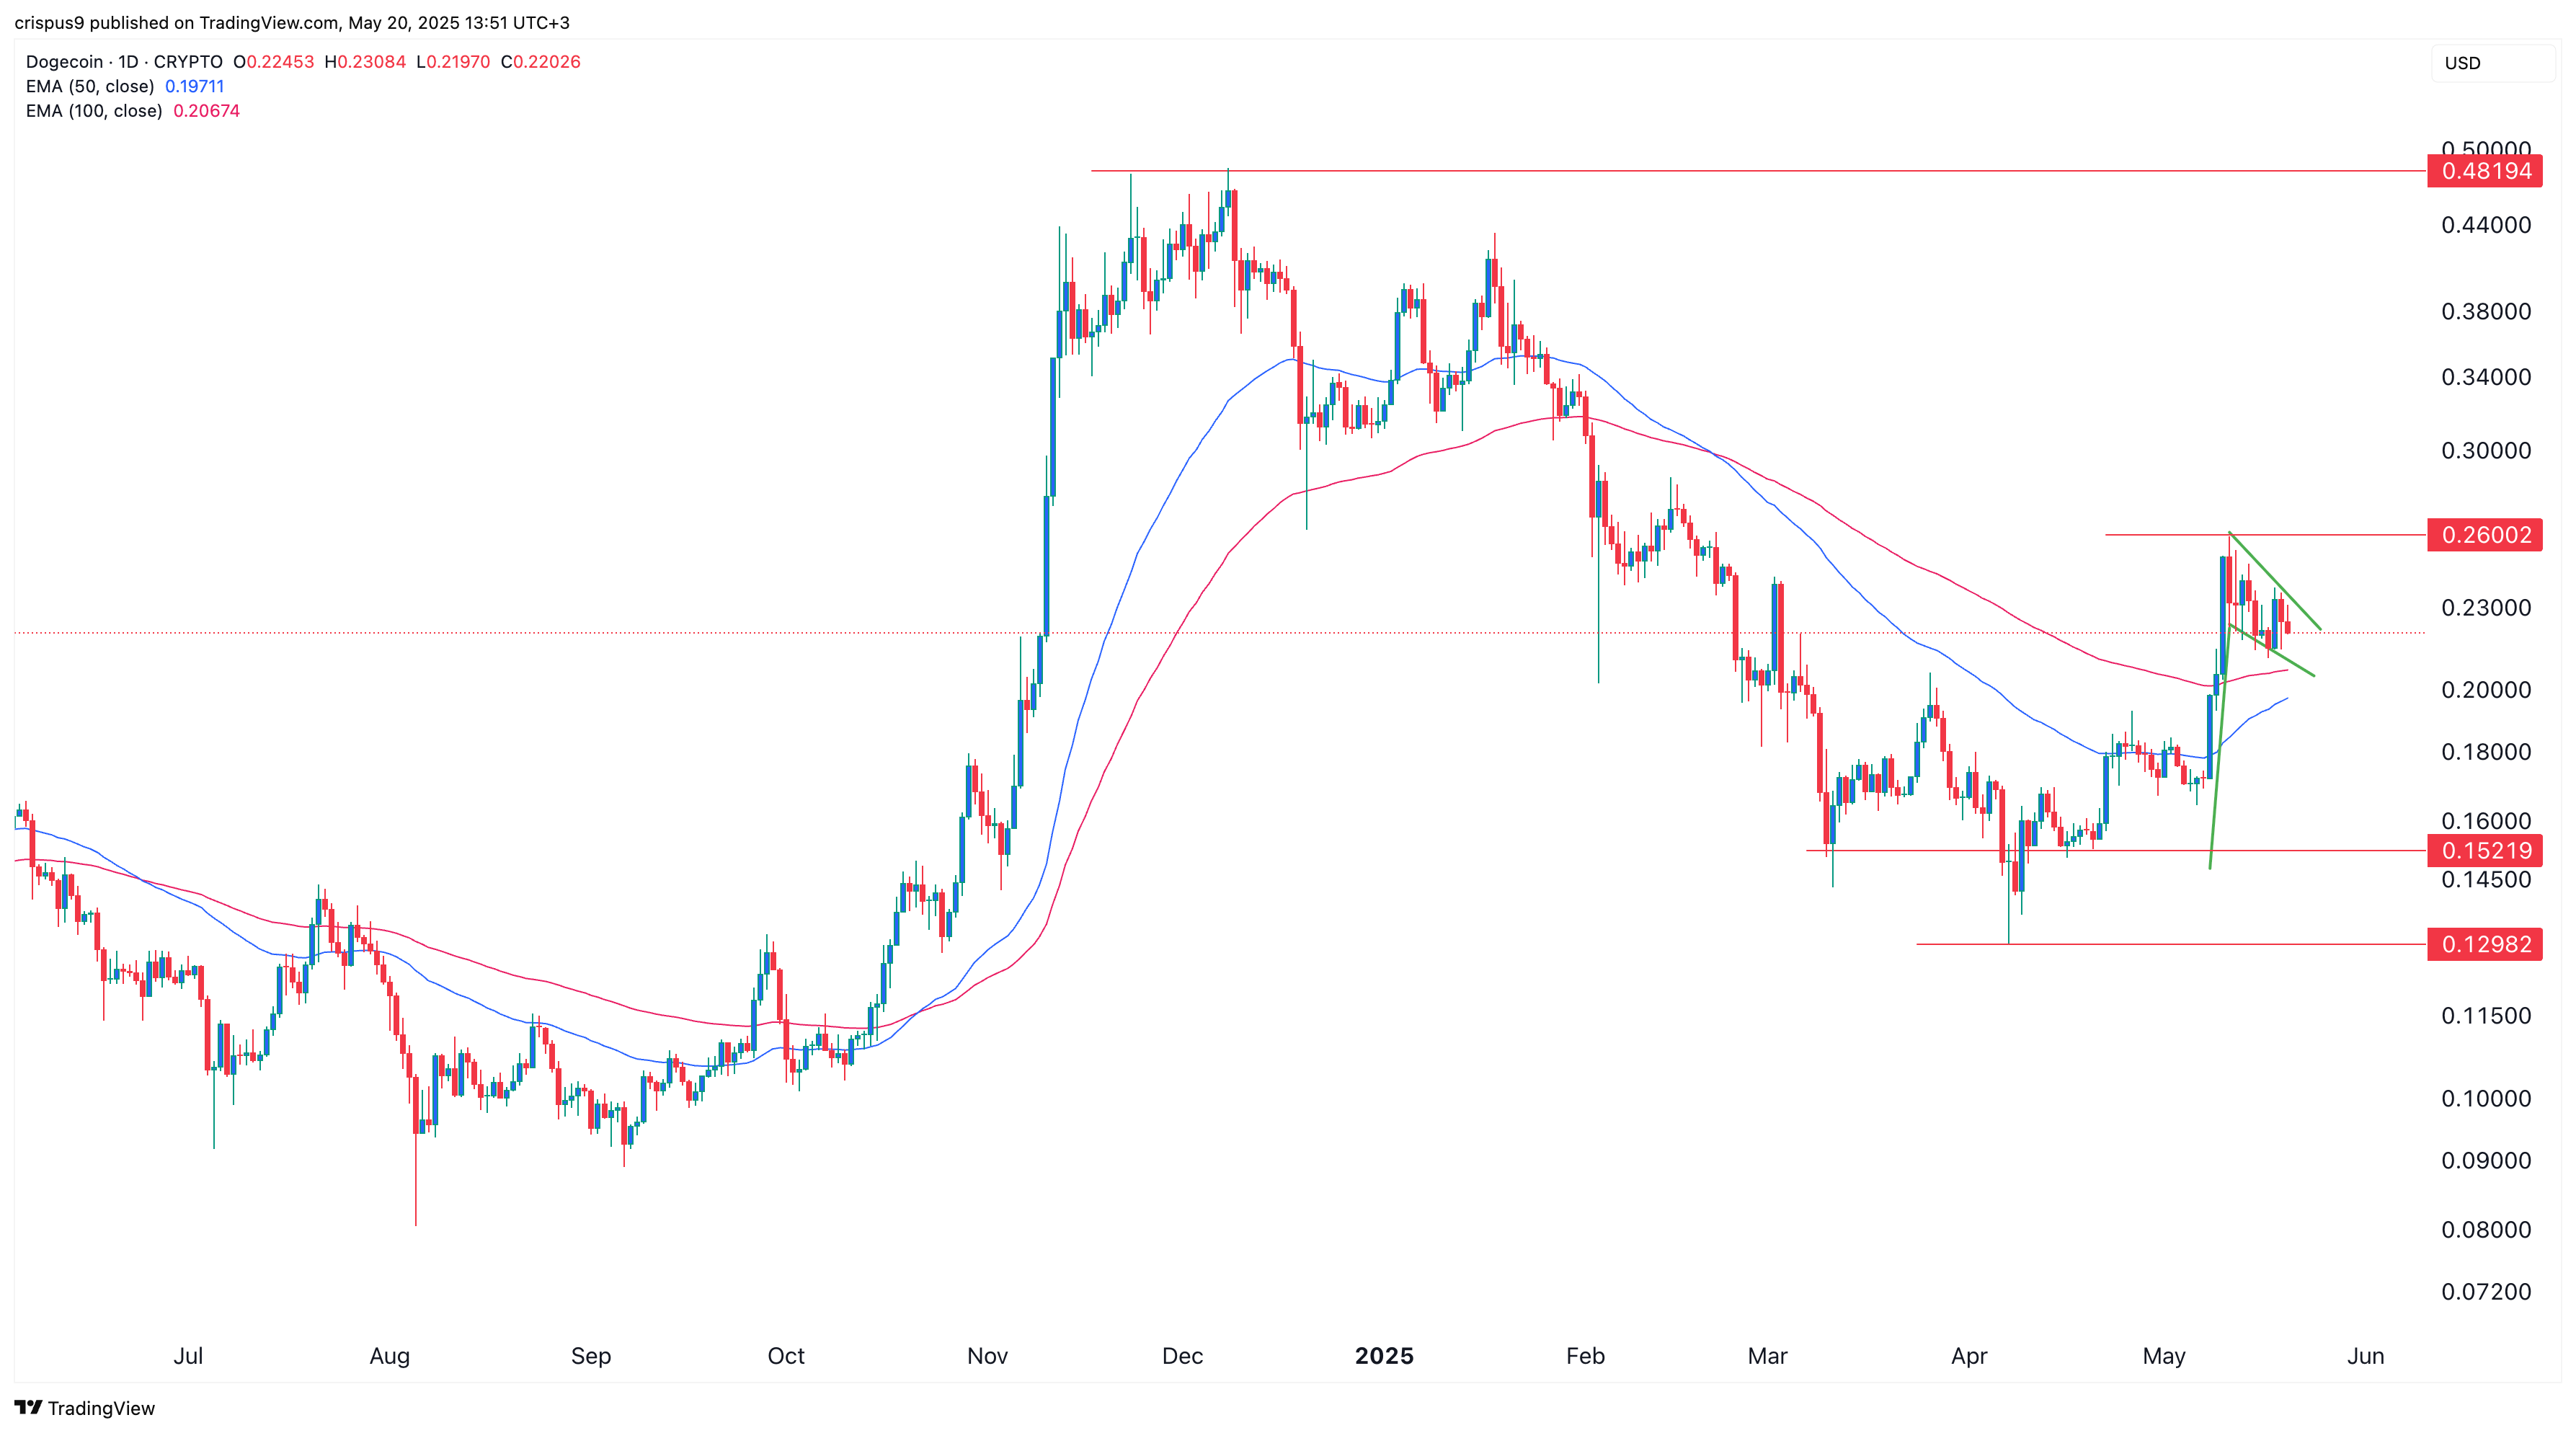
The daily chart shows that Dogecoin peaked at $0.2600 last week before trending down to $0.2200.
It has now formed a bullish flag pattern, a popular continuation signal. This pattern features a sharp upward move followed by a period of consolidation that resembles a hoisted flag. Typically, it leads to a strong breakout.
Before this flag happened, DOGE price also formed an inverse head and shoulders pattern. The head section was at $0.1298, its lowest point on April 7, while the shoulders were at $0.1520.
Dogecoin remains above the 50-day and 100-day Exponential Moving Averages. Based on this setup, the coin is likely to break out and potentially retest the November 2024 high of $0.4820, a move that would represent a 120% increase from current levels.
DOGE price forms giant megaphone on the weekly chart
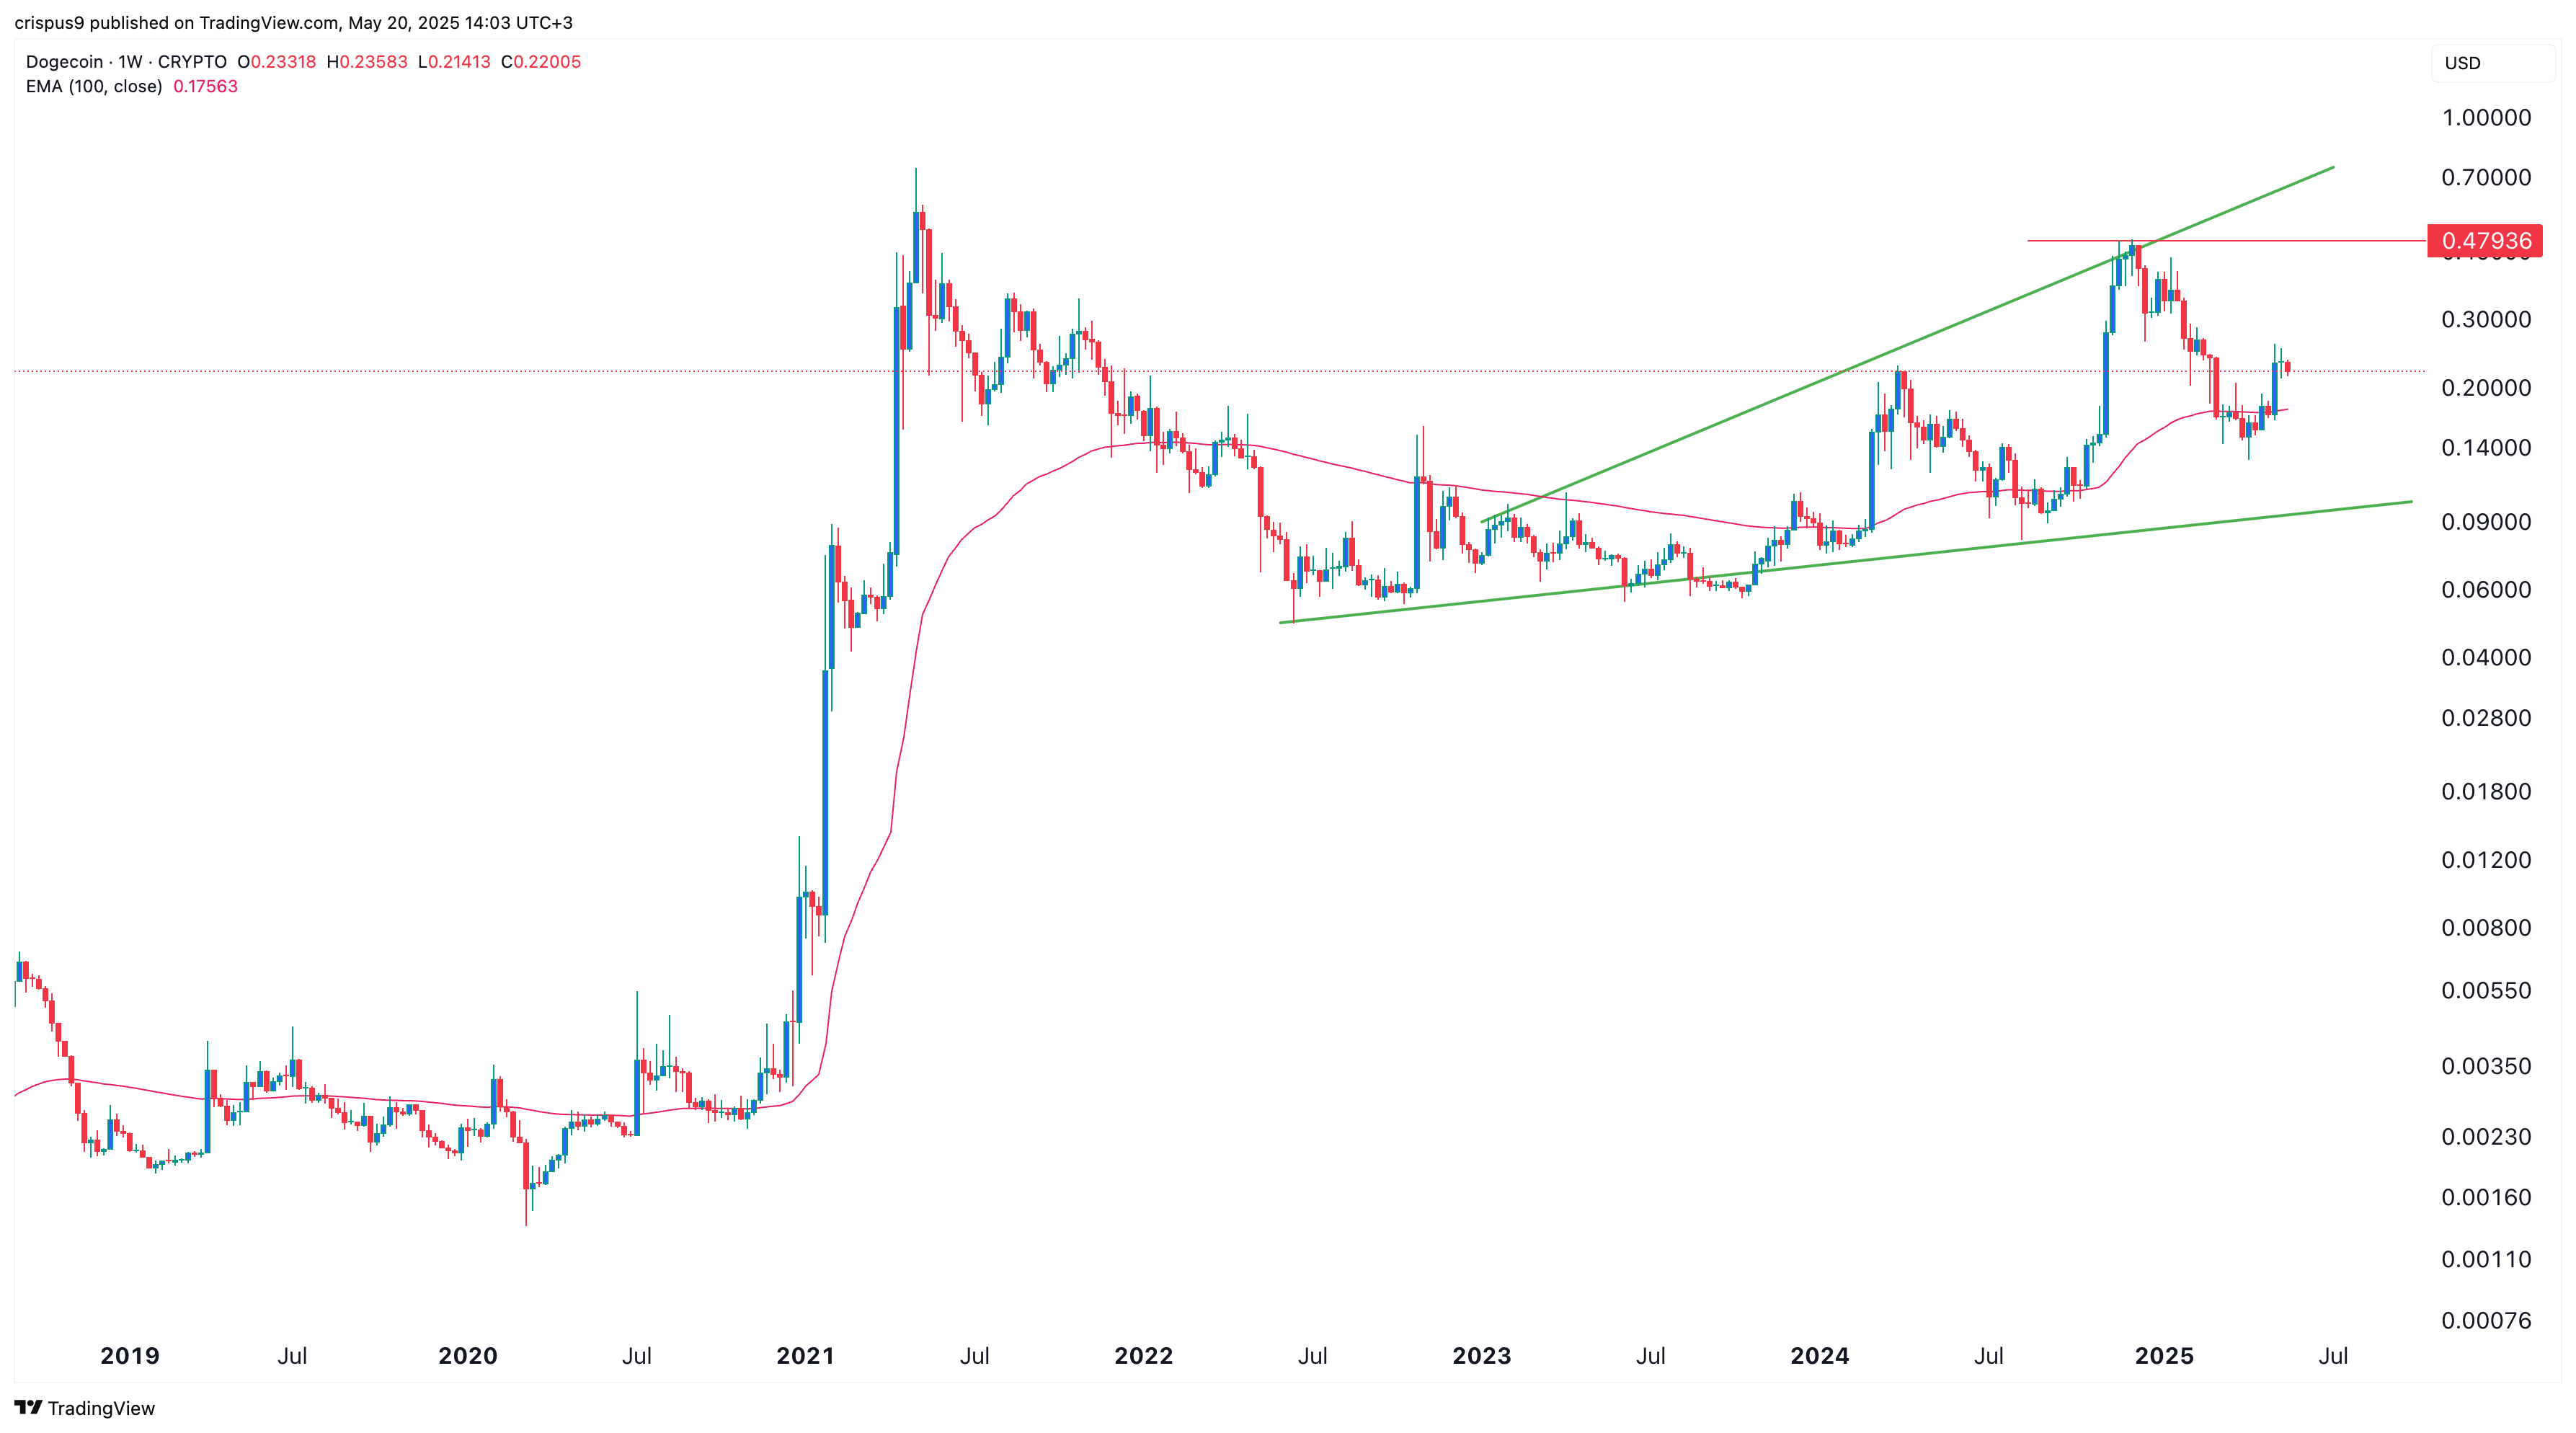
The weekly chart also supports a bullish outlook, showing DOGE forming a giant megaphone pattern, defined by two ascending and diverging trendlines.
In this case, the lower trendline connects the lowest swing levels since January 2022, while the upper trendline links the higher highs since January 2023.
This structure typically precedes increased volatility and broader upside potential. If the breakout plays out, the first key level to watch will be $0.4820. A decisive move above that could pave the way for a run toward the psychological $1.00 mark.