Chart of the day: Dogecoin traders await 10% rally, with bullish signs on daily and weekly chart

In just three days, Dogecoin has climbed over 50%, but the meme coin’s rally is likely to extend. An analysis of on-chain and technical indicators and derivatives market data shows that DOGE could test its October 2021 peak.
Table of Contents
Dogecoin hits three-year peak, gears for 18% gains
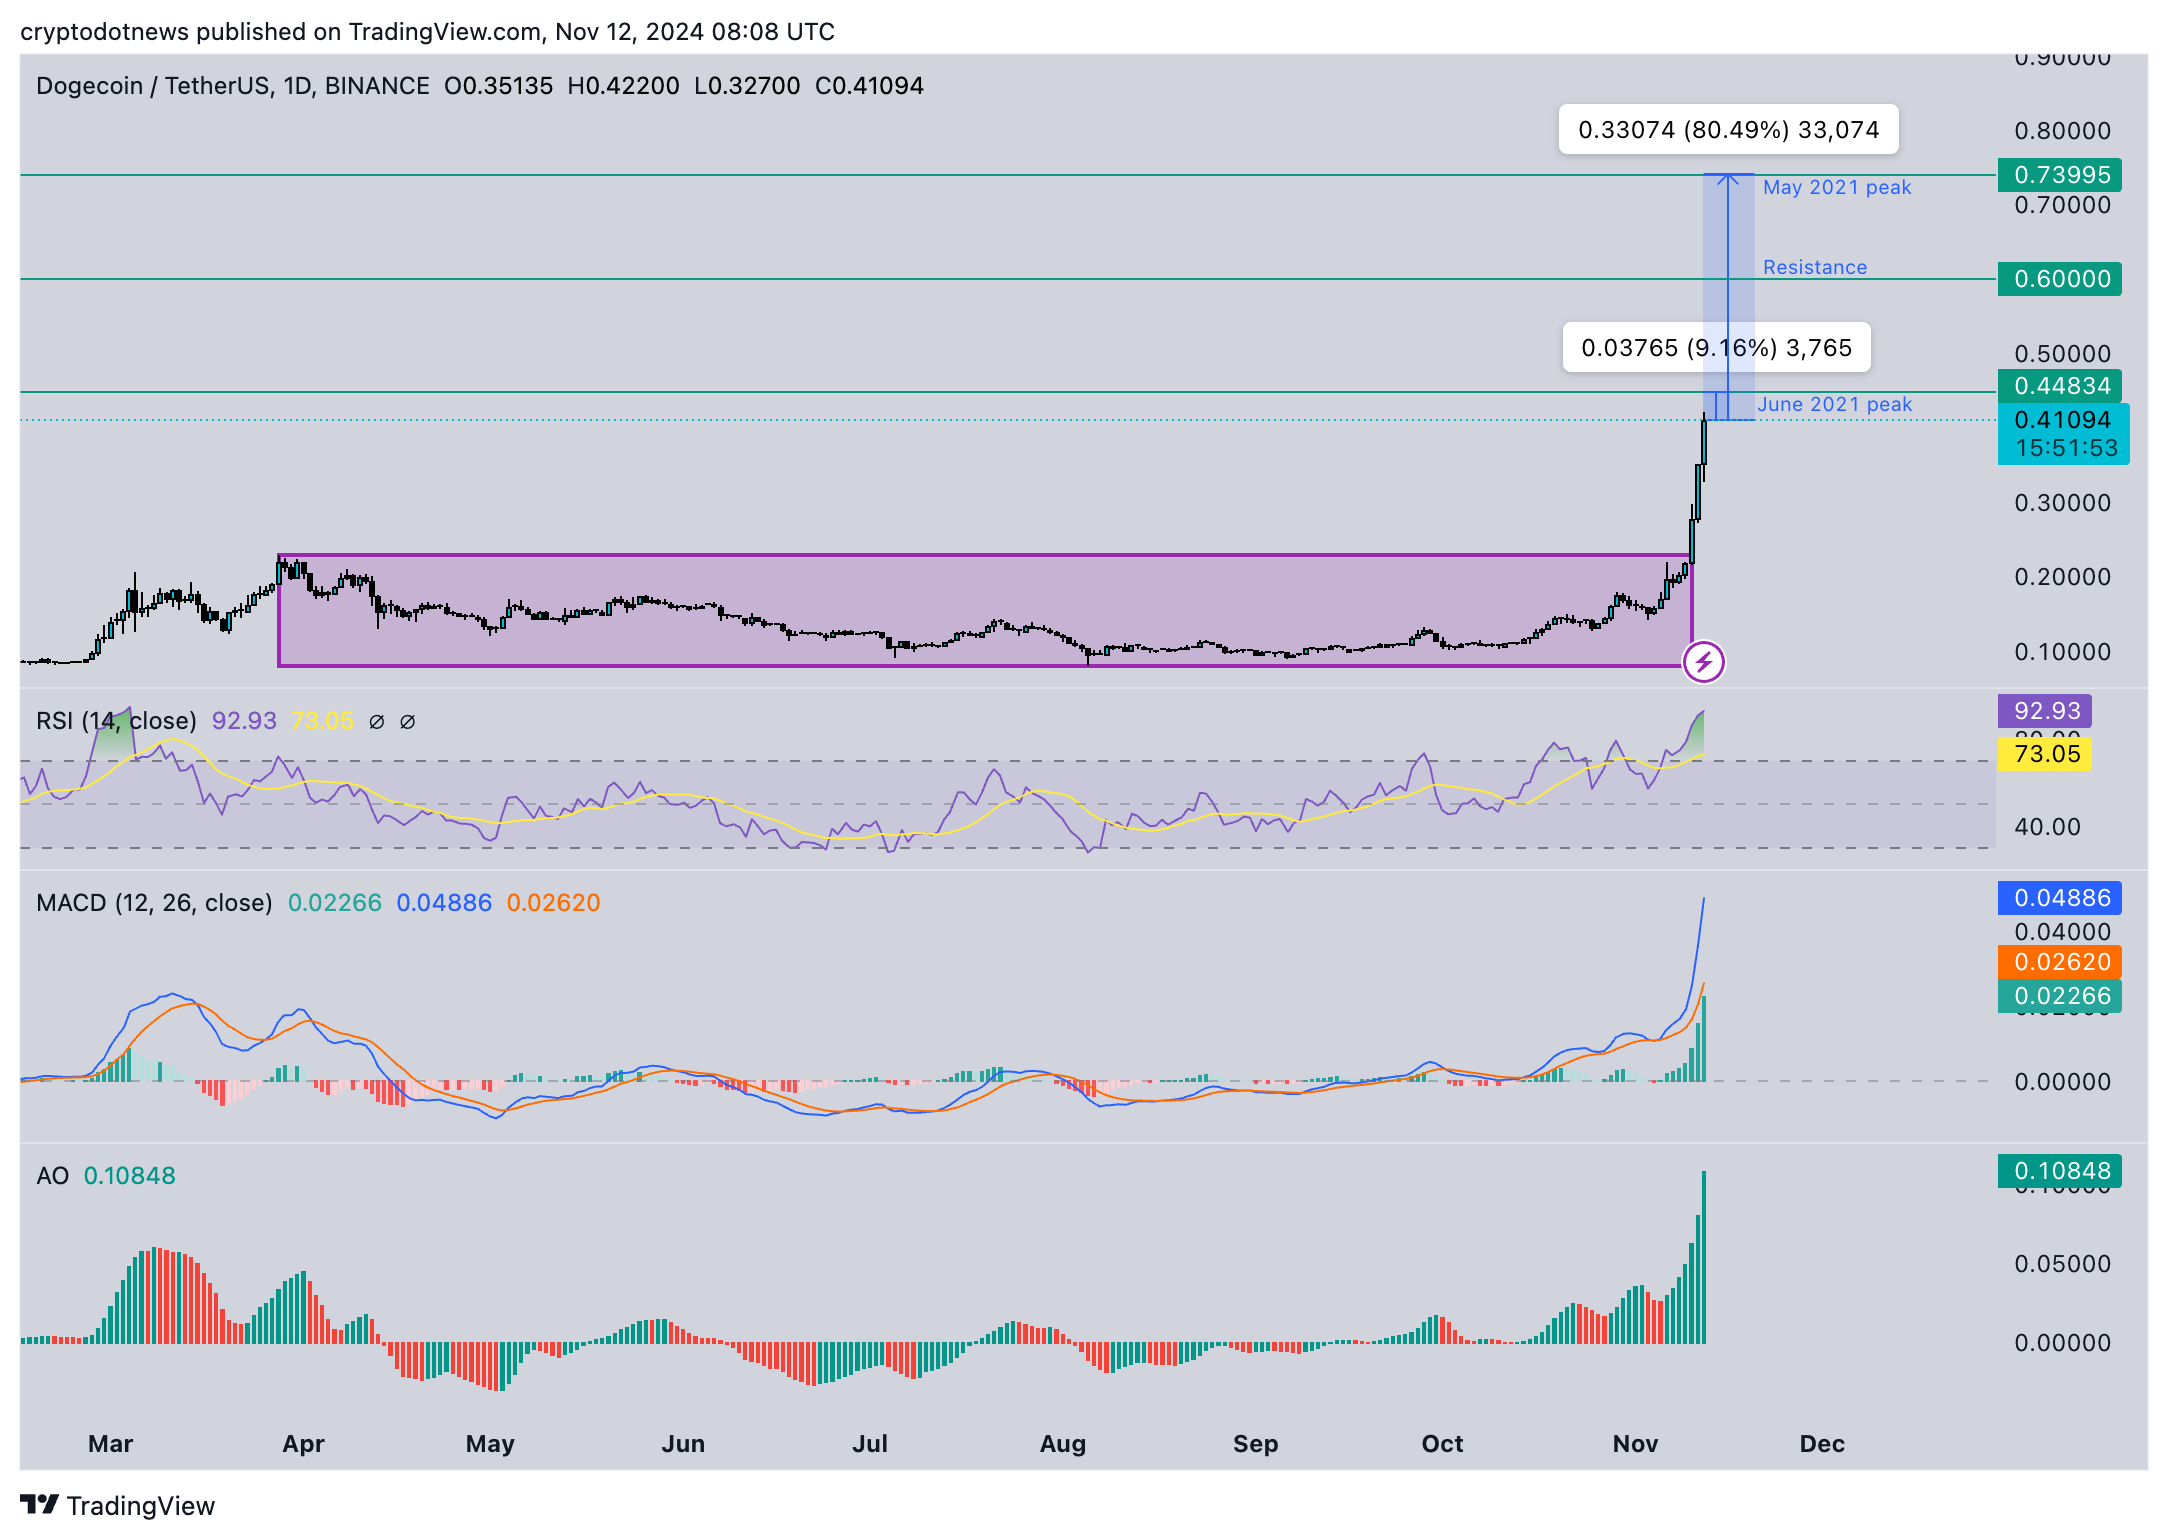
Dogecoin (DOGE) rallied to a high of $0.42200 on November 12, its highest level in nearly three years. The largest meme coin is likely primed for further gains as technical indicators suggest the uptrend could continue.
DOGE consecutively formed higher highs and higher lows since October 3.
The moving average convergence/divergence indicator is a momentum oscillator primarily used to identify whether a token has underlying positive or negative momentum. This helps traders determine overbought or oversold conditions and identify upcoming trend reversals. MACD shows consecutively tall green histogram bars above the neutral line, signaling an underlying positive momentum in Dogecoin price.
The awesome oscillator is typically considered a “lagging” indicator, but it helps confirm trends and predict an upcoming impulse or movement in the token’s price. The AO on Dogecoin’s daily price chart shows that DOGE’s trend confirms the uptrend.
DOGE successfully rallied past the October 2021 peak of $0.340000, and tackled resistance at the August 2021 high of $0.351700.
The June 2021 peak of $0.448340 is the next key resistance, 9% away from the current price. Once DOGE successfully flips this level, the May 2021 peak of $0.739950 is the target, 80% above $0.410940.

The relative strength index has generated a sell signal on the daily price chart, with RSI at 92. This implies that Dogecoin is “overbought” and a correction is likely in the meme coin. Traders need to watch this indicator closely when opening a long position in DOGE.
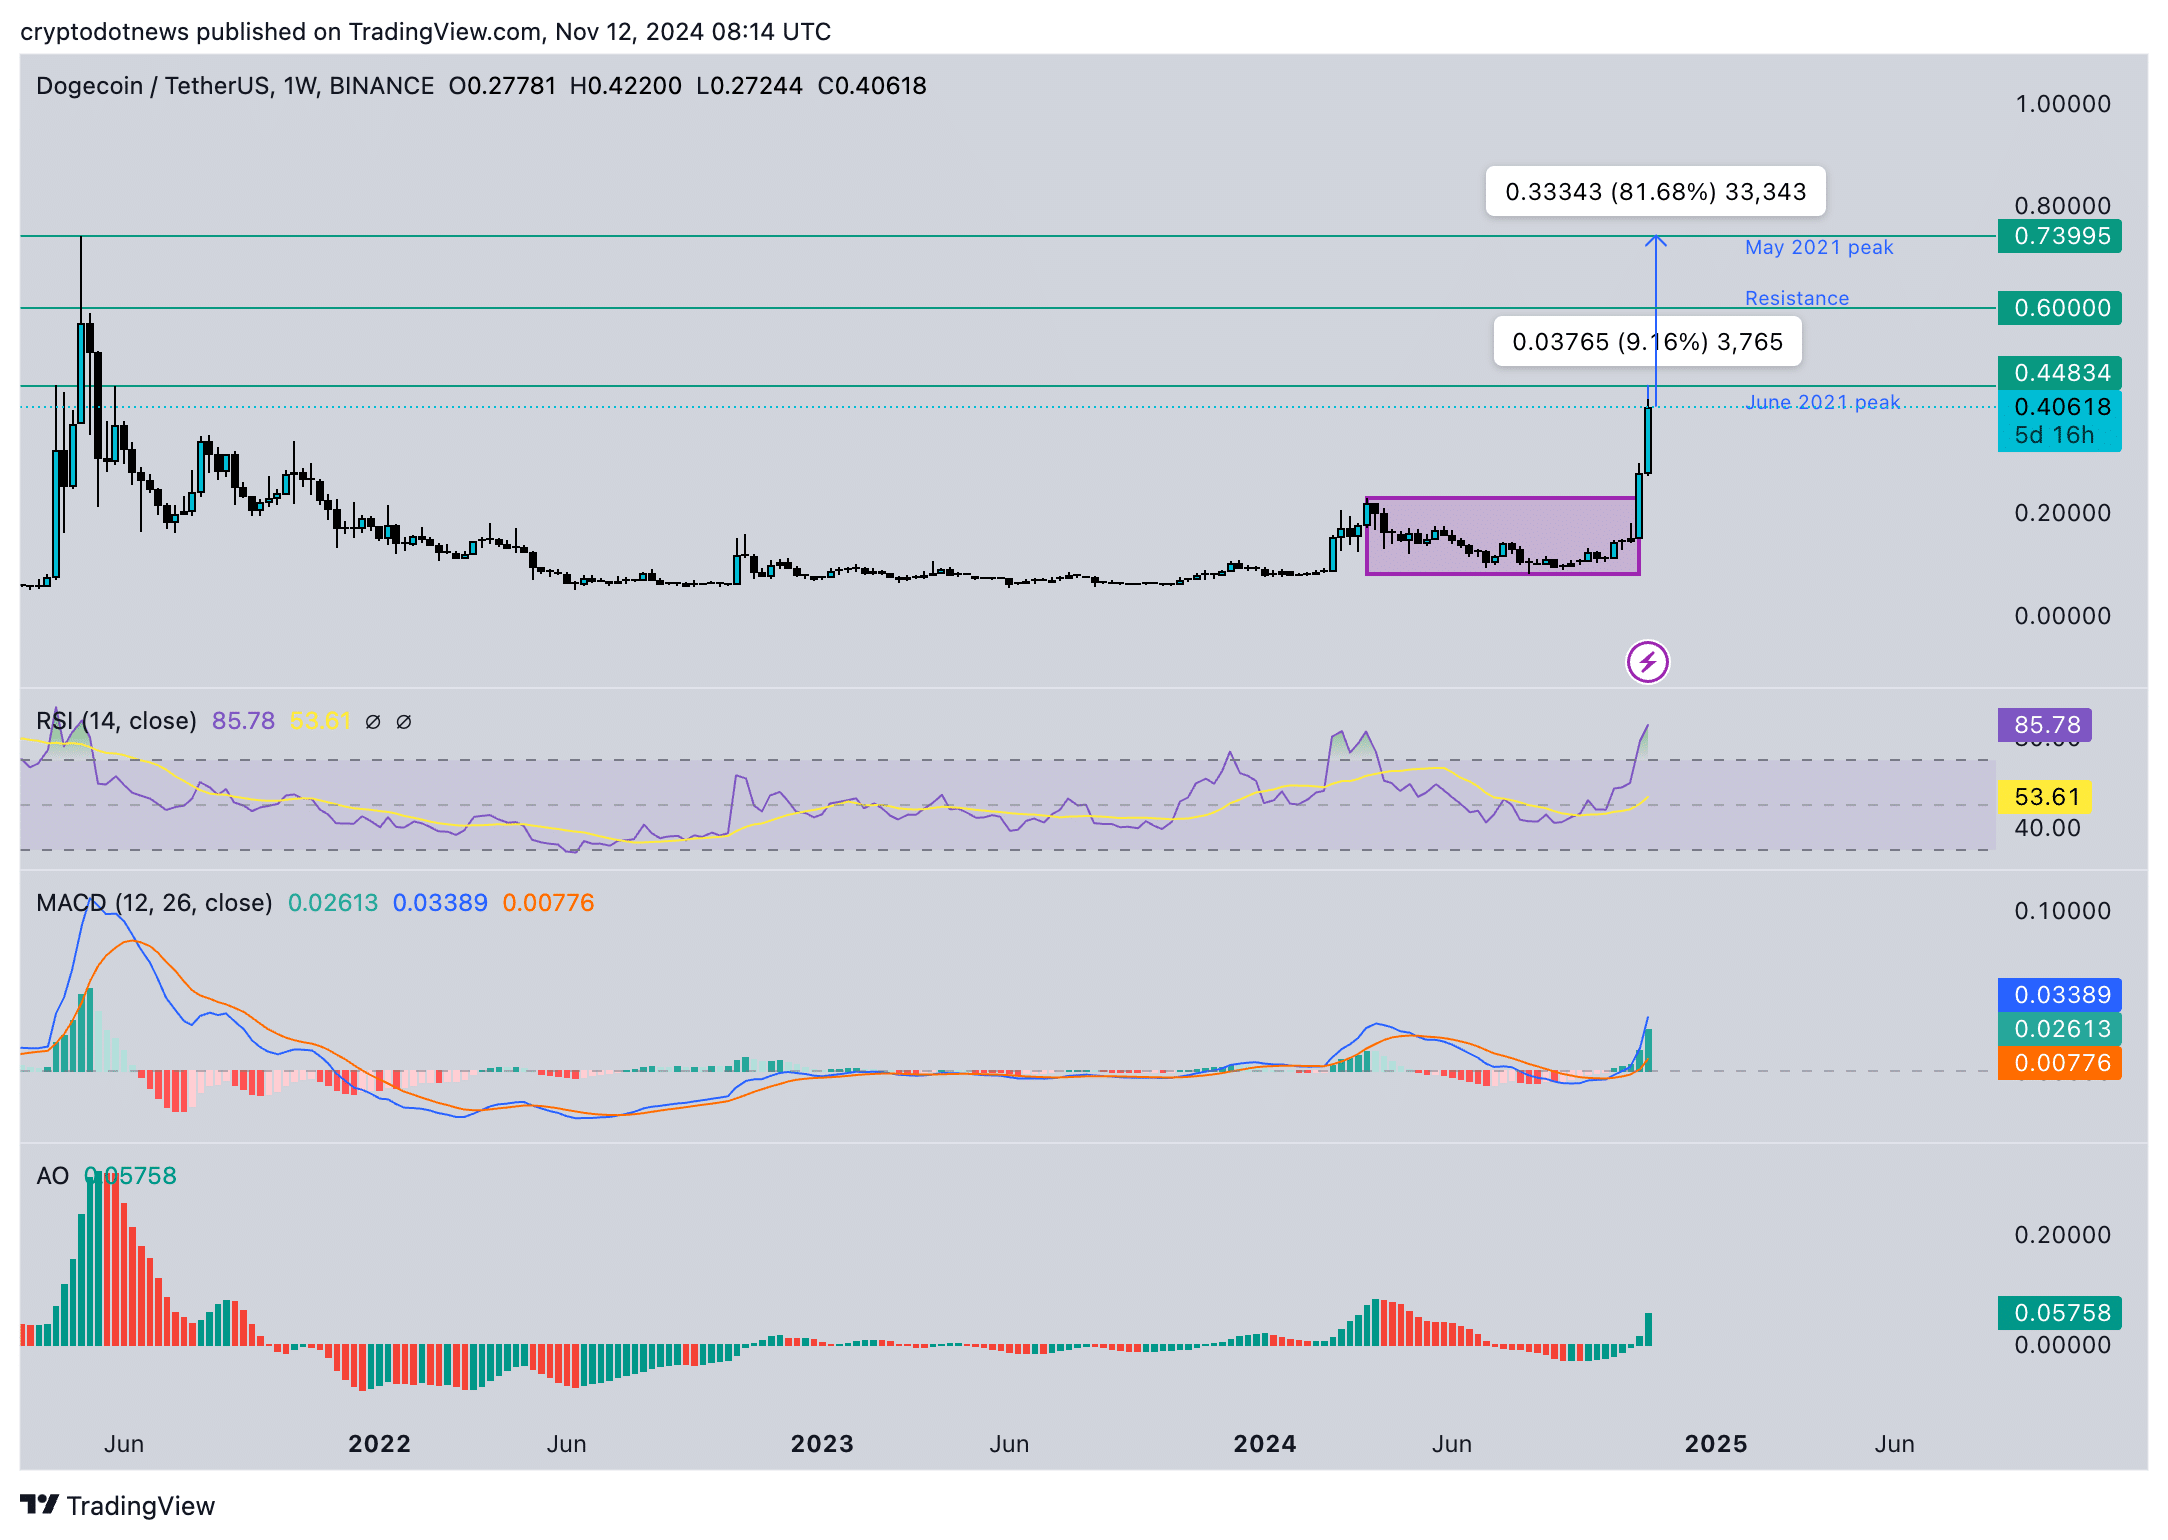
The weekly price chart confirms the trend and shows DOGE has slipped out of the range bound price action between the upper boundary of $0.228880 and lower boundary of $0.08050. The three technical indicators, MACD, AO and RSI draw similar conclusions as the daily price chart.

Derivatives traders are bullish on DOGE
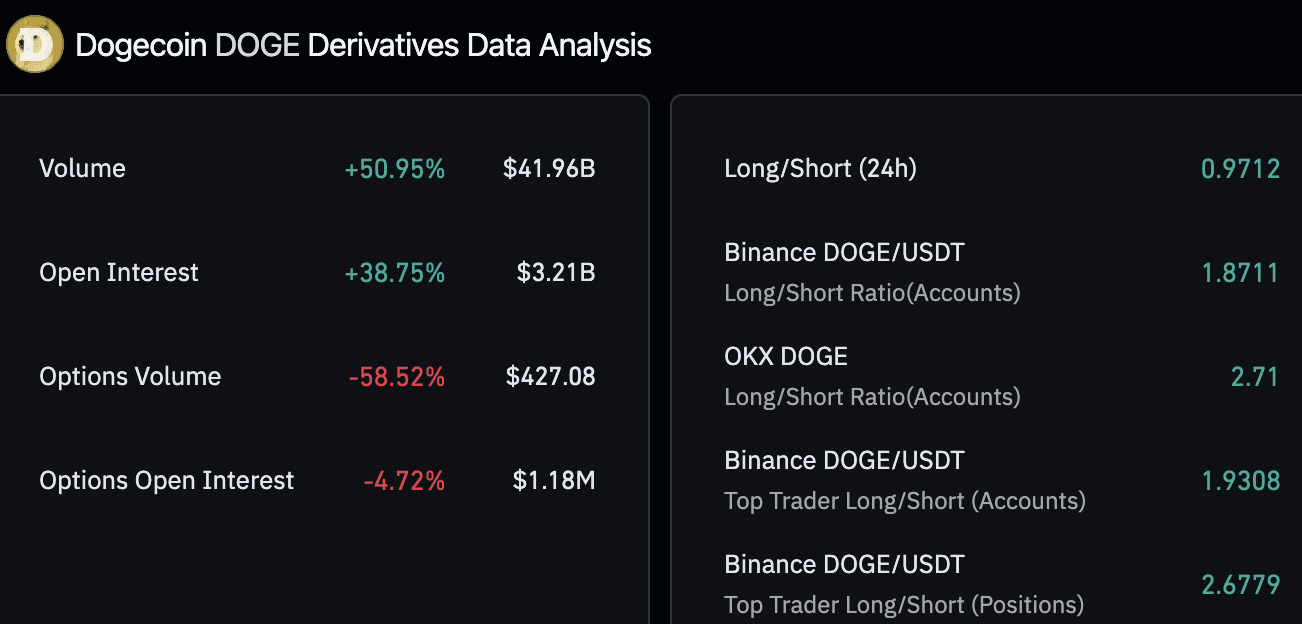
The open interest in Dogecoin noted a large spike, climbed to $2.86 billion on Tuesday, November 12. This is the highest level in nearly three years. Coinglass data shows a 38% increase in open interest in the last 24 hours.

Typically, an increase in open interest supports a price gain thesis for the token. Derivatives data analysis from the last 24 hours shows traders expect DOGE price to climb higher, as long/short ratio is higher than 1 across exchanges like Binance and OKX.
A ratio higher than 1 indicates that there are more traders betting on DOGE’s price increase. This means derivatives traders are bullish on DOGE’s price gain and the meme coin could extend its price rally in the short-term.

On-chain indicators show whales making moves in DOGE
Large wallet investors, labeled as whales, increased their Dogecoin transactions on November 6 and 10. The two events are marked as large spikes in the whale transaction count chart on Santiment.
An increase in whale transactions is typically indicative of large wallet transfers involving the meme coin. This could either be accumulation by whales or transfers to or from exchange wallets.
The Santiment chart shows that spikes in whale transactions coincide with local price tops in Dogecoin.

The count of active addresses is an on-chain metric that helps identify the relevance of a token among crypto traders. Active address count noted a spike on November 6 and 10, alongside a spike in transaction volume. Similar spikes correspond to local price tops for Dogecoin, as seen in the Santiment chart below.

Strategic considerations
The on-chain and technical analysis of Dogecoin was performed at a time when Bitcoin hit a new all-time high at $89,940 on November 12, 2024. Data from Macroaxis.com shows that Dogecoin and Bitcoin are correlated, the co-efficient is 0.94, meaning that a correction in BTC could negatively impact DOGE.
Dogecoin’s price gain is therefore likely to be influenced by Bitcoin’s price trend, state of the crypto market, and the meme coin sector performance, among other market movers.
Disclosure: This article does not represent investment advice. The content and materials featured on this page are for educational purposes only.


