ETH/BTC price hits 4-year low as bearish pattern suggests record downside ahead


Ethereum price continues its freefall and has formed an inverse cup and handle pattern, pointing to further downside to a record low
Ethereum (ETH) has dropped for three consecutive weeks and is hovering at its lowest level since January 2020 against Bitcoin (BTC). The ETH/BTC pair plunged to a low of 0.019, down more than 80% from its peak in December 2021.
ETH has also declined from last year’s high of $4,000 to below $1,500, while its market cap dominance has fallen 67% from its 2021 highs and is now approaching 2022 levels.
The ongoing selloff began in September 2022 after Ethereum executed The Merge, transitioning to a proof-of-stake consensus model. This upgrade was intended to improve scalability, efficiency, and sustainability — aligning Ethereum more closely with networks like Solana (SOL) and Avalanche (AVAX).
However, Ethereum has faced growing headwinds. Spot Ethereum ETFs have seen a muted response on Wall Street, with cumulative inflows of under $2.6 billion. In total, ETH ETFs hold just $4.9 billion in assets — compared to the $85 billion in Ethereum investment funds — signaling that many investors continue to prefer Bitcoin as a store of value.
Ethereum is also facing increasing competition from its own layer-2 ecosystem, including Base, Arbitrum, Polygon, and Optimism. According to DeFi Llama, DEXs built on Ethereum processed $57.9 billion in volume over the past 30 days, while L2 networks handled over $35 billion in the same period.
Additionally, Ethereum has become a less profitable chain in 2024. Its fee revenue trails behind competitors like Tron, Solana, and Jito.
Ethereum price could crash to an all-time low
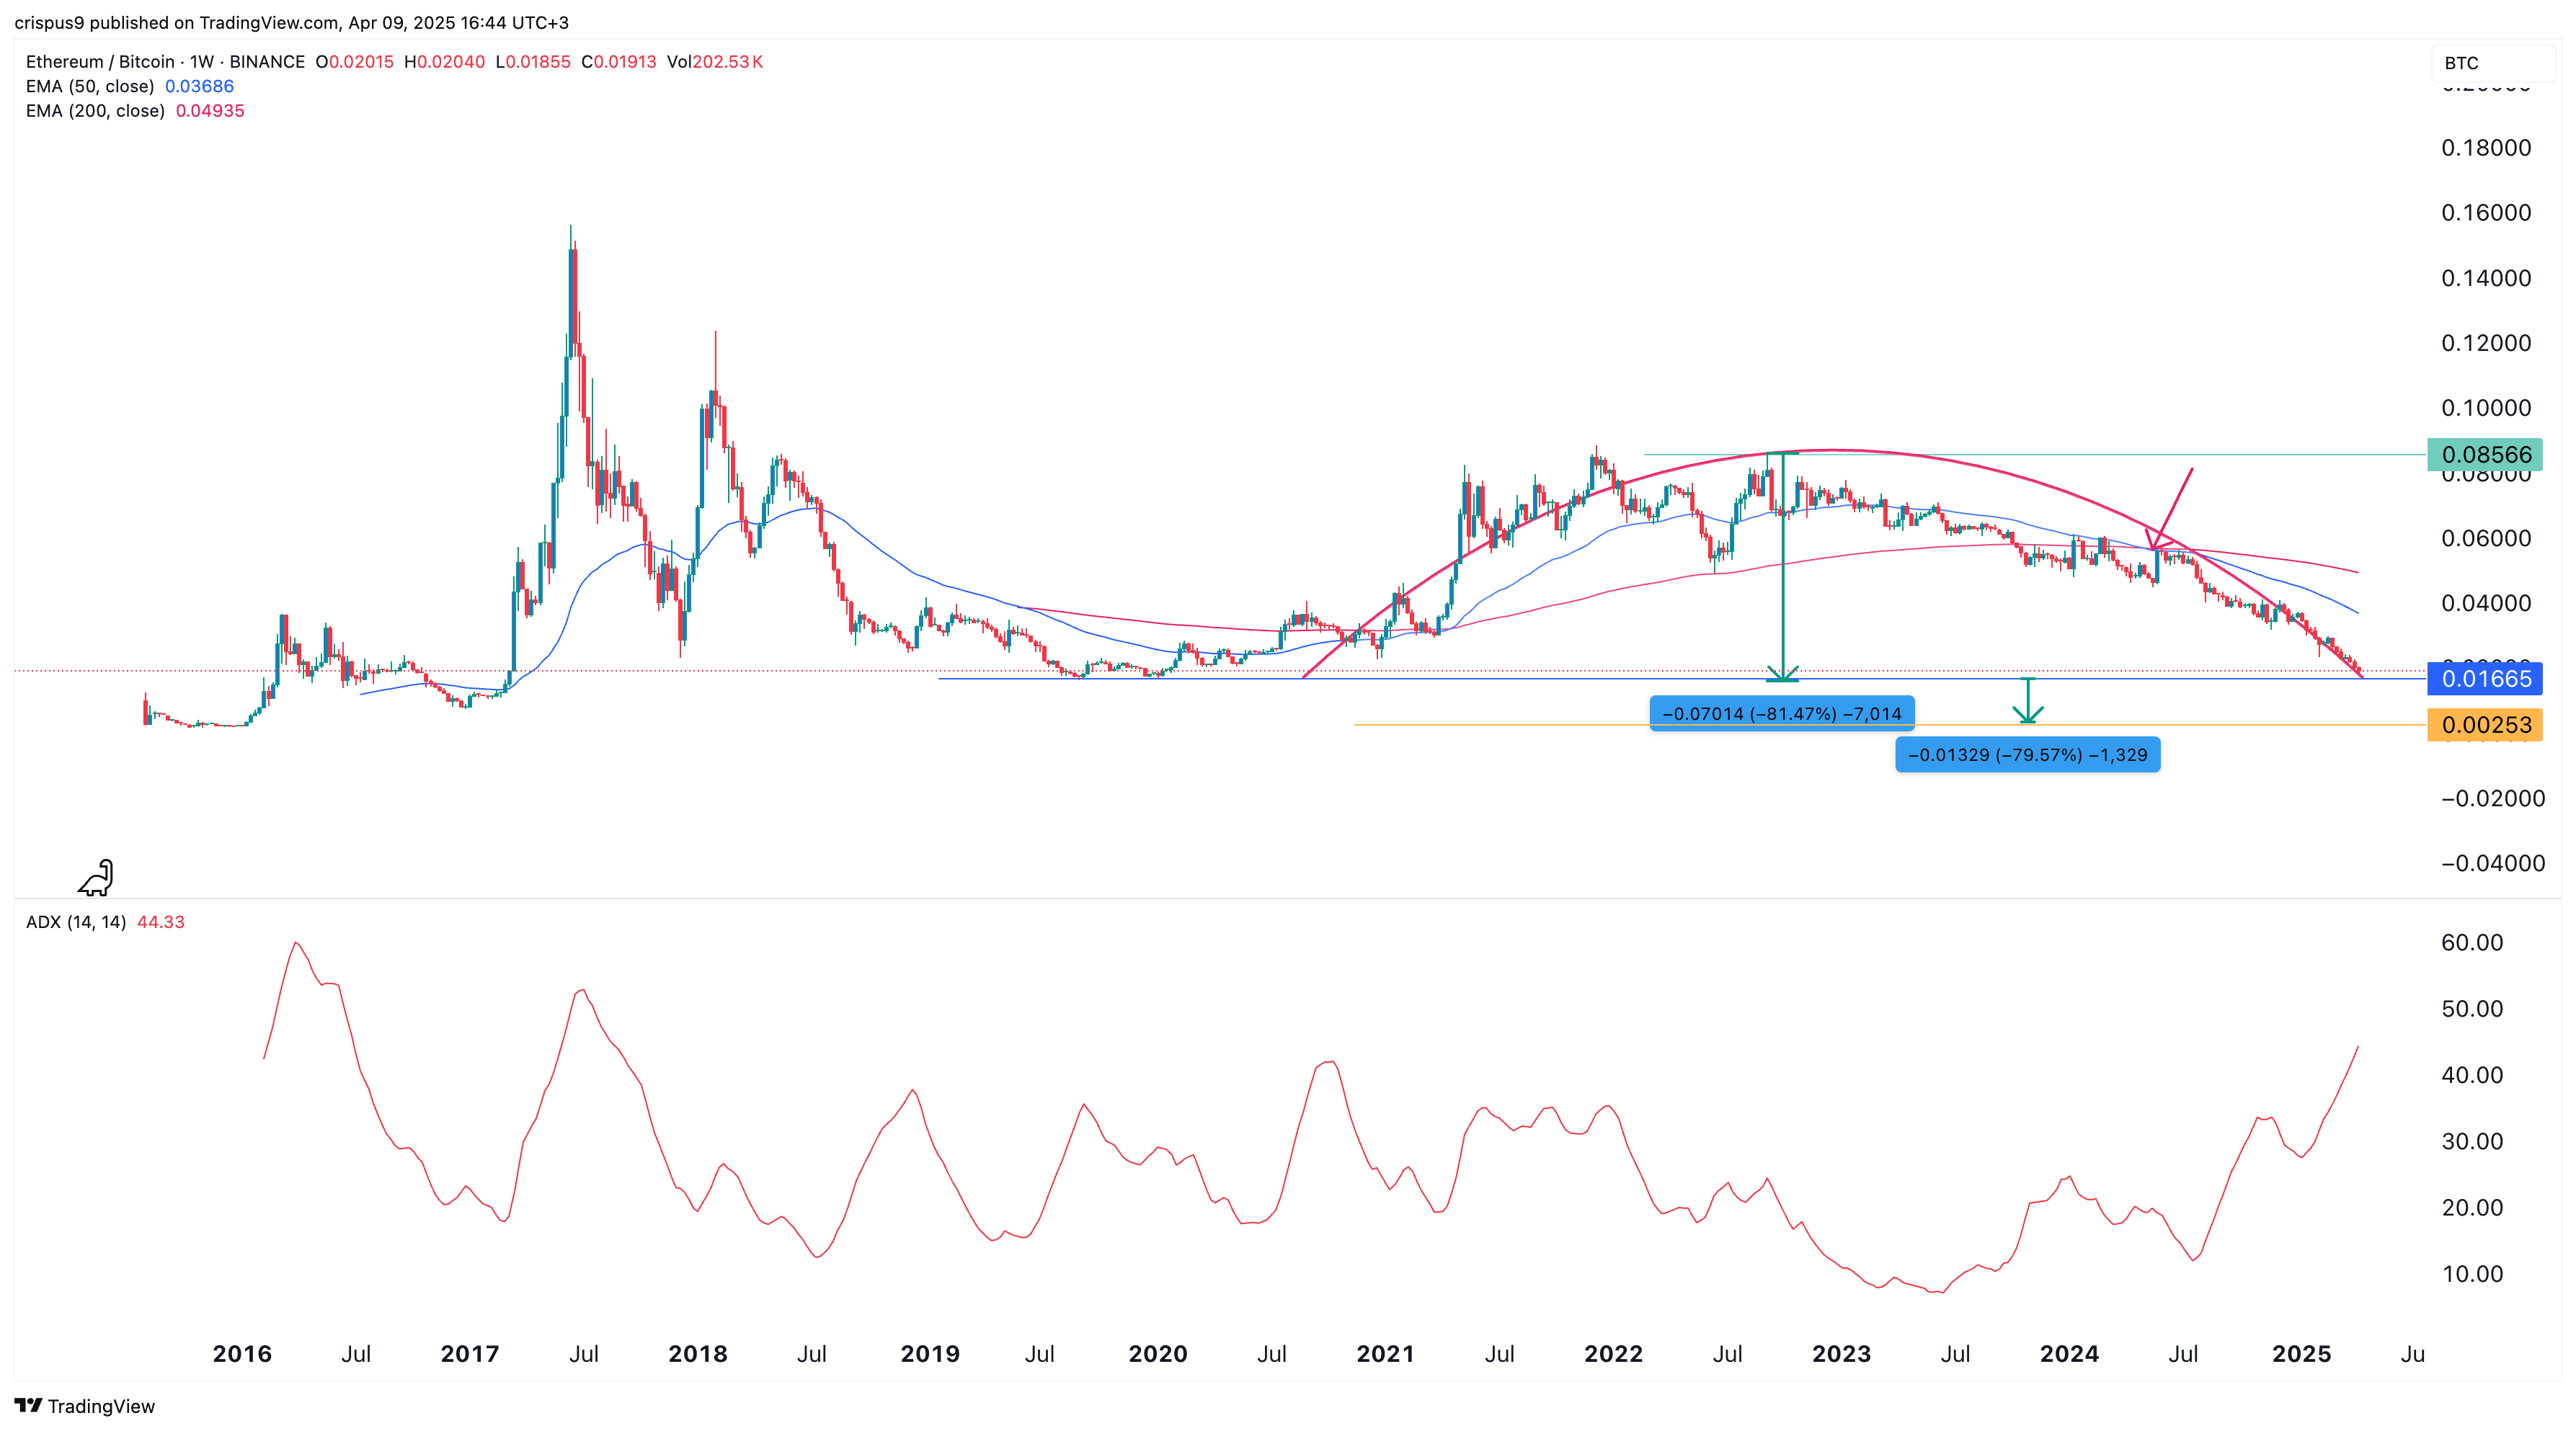
The weekly chart shows that ETH has been in a sustained downtrend against Bitcoin. A death cross — where the 50-week and 200-week moving averages intersect — formed in May last year, confirming bearish momentum.
More recently, ETH has formed an inverse cup and handle pattern, a well-known bearish continuation signal. This pattern typically features a rounded top followed by a horizontal support level, signaling potential for further breakdown.
The Average Directional Index has risen to 44, indicating that the current downtrend is gaining strength. Based on the depth of the cup, technical projections suggest that ETH could fall to an ETH/BTC pair of 0.0025, near its all-time low.