ETH-USD Down Over 5 Percent Today; Looking to Test $11
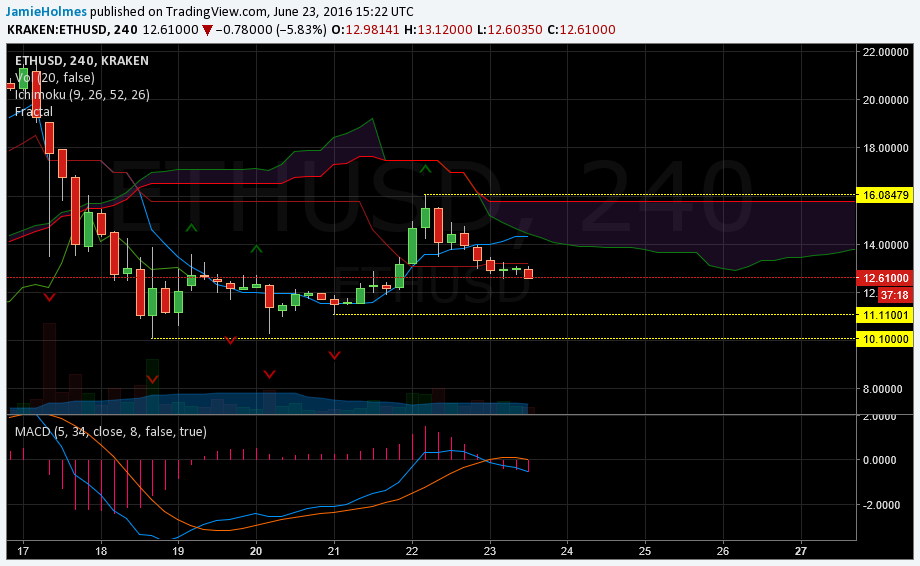
ETH-USD markets, which generally have a negative correlation with BTC-USD, have recently started to trade with a positive correlation. On the Kraken exchange, the virtual currency is down 5.87 percent against the U.S. Dollar on today’s open, currently trading at $12.60350. The market looks to be making another test of the psychological support at $11, as illustrated by the 4-hour chart below. The market has managed to establish a close below the base (dark-red) line at $13.1979 and signals a shift to bearish momentum. This level will now act as resistance going forward and provide a good entry into short positions.
The most recent fractal buy and sell levels are also illustrated on the chart. Fractal support is seen at $11.11001; there is a higher probability of the market tending toward this fractal level, since the market has closed below the base line and the MACD is also confirming bearish momentum as the histogram is negative. A break of the fractal buy level at $11.11001 could see a test of $10.
On the other hand, buyers should look for a 4-hour close above the base line to find potential long opportunities in ETH-USD. When this occurs, the market will then look to test the fractal resistance at $16.08479. However, the conversion line also offers resistance at $14.3424. The Ichimoku cloud is very thick and the color is red so this suggests a strong resistance zone in the area around $14.00 and $15.795.
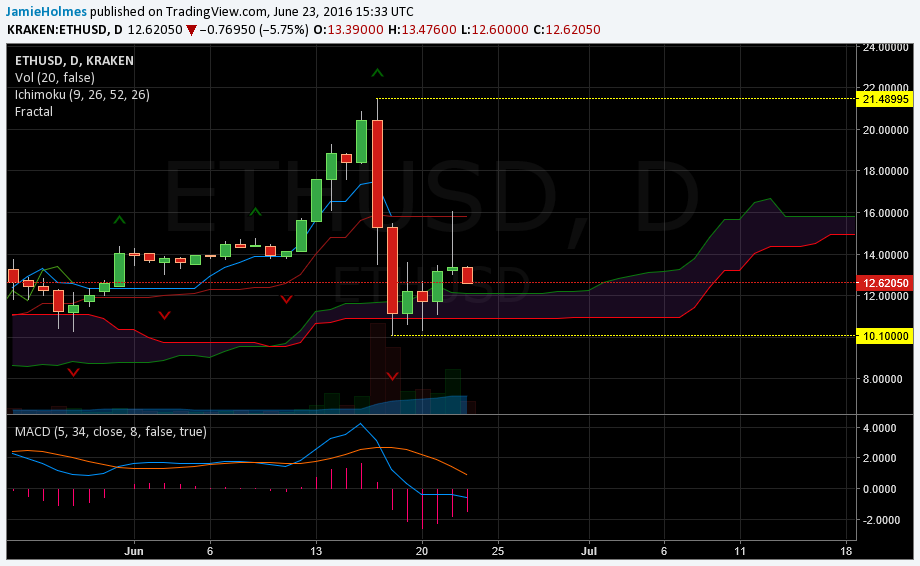
The longer-term outlook is illustrated by the daily chart below. Yesterday, the price action attempted to test resistance provided at $15.795 by the base line at this timeframe but was rejected. Sellers managed to bring the closing price back down to $13.39. Yesterday’s candlestick pattern is known as a ‘gravestone doji’ and indicates the end of an upward trend. This suggests that ETH-USD will continue downward over the coming days; whether or not the market will break below the Ichimoku cloud will be crucial going forward.
The Ichimoku cloud shows that a support zone is found between $10.92 and $12.00 and a daily close below the cloud would signal the start of a downward trend over the long-term. This would be further confirmed if the conversion line diverges from the base line and moves below the base line. Also, a daily close below the fractal support at $10.10 would see sellers target previous fractal supports at $9.73 and $8.978.
On the other hand, the fact that the price action has not managed to sustain below the cloud yet suggests that buyers are still in control over the long-term. The Ichimoku cloud is still green and further bearish confirmation will be given if it starts to look as if it will change color to red. Also, the histogram of the MACD indicator is trending higher, suggesting that bearish momentum is fading. The most recent fractal resistance is at the all-time high above $21 but a new fractal sell level looks to be forming at $16.08479 (yesterday’s high). Therefore, short positions are favored on breaks below $11.11, and long positions are favored on breaks above $16.08479.